• Home
  • Forums
  • Trades
  • News
  • Calendar
  • Market
  • Brokers
  • Login
  • Join
  • User/Email: Password:
  • 12:42am
Menu
  • Forums
  • Trades
  • News
  • Calendar
  • Market
  • Brokers
  • Login
  • Join
  • 12:42am
Sister Sites
  • Metals Mine
  • Energy EXCH
  • Crypto Craft

Options

Bookmark Thread

First Page First Unread Last Page Last Post

Print Thread

Similar Threads

Are you a trend trader or a counter-trend trader? 29 replies

Trading bounces off daily chart trend lines 13 replies

Trend trading with 55EMAs on the Daily Chart 10 replies

Is Grid Trading (combined trend following and counter trend) Profitable? 3 replies

Using trend on 1hr chart for trading on 15m chart 0 replies

  • Interactive Trading
  • /
  • Reply to Thread
  • Subscribe
  • 583
Attachments: Trend Trading Chart Thread
Exit Attachments
Tags: Trend Trading Chart Thread
Cancel

Trend Trading Chart Thread

  • Last Post
  •  
  • 1 3738Page 394041 107
  • 1 Page 39 107
  •  
  • Post #761
  • Quote
  • Jan 22, 2010 10:57am Jan 22, 2010 10:57am
  •  coolshades
  • | Joined Nov 2006 | Status: very junior member | 1,576 Posts
the problem is you are forcing it on us despite being politely told that this thread is for a different system.

no doubt your system is very successful to you and many others. as you yourself said, traders help traders so please start your own thread.


Quoting trade price
Disliked
if you think spam dont take it .find the holly grail and let me know .
traders help traders.take it or leave it .no one forcing you.and its free.
all the best
http://cdn.forexfactory.com/images/icons/icon7.gifhttp://cdn.forexfactory.com/images/icons/icon14.gif
Ignored
 
 
  • Post #762
  • Quote
  • Jan 22, 2010 1:24pm Jan 22, 2010 1:24pm
  •  DanUK
  • Joined Nov 2008 | Status: You must obey the dance commander | 2,038 Posts
Quoting trade price
Disliked
i mean entering with the trend with price confirmation.yes you can say jakos system or any body.with bigger trend theres lot of smaller trend . enter with price confirmation and take advantage of smaller move ment or exit the possition.
i belive exit is most important than entry.i am a day trader some time i do take swing trade.
its your thread if you dont mind i will post some charts and explain how i trade.
if any one gets little from me i will be glad i helped someone .any question ?
Ignored
Hi,

You are welcome to post charts here but they must have some resemblance to what we are trading here otherwise it will distract from what we are trying to do here - that is to discuss potential trades and to dissect trades taken in accordance with the general rules detailed in the first post of the thread.

It is clear that no one here wants to deviate from the original method so please respect that. Also we generally discuss H4/daily charts so please don't post any charts smaller than H1.

Please don't take this the wrong way - every one is welcome here, but I don't want this thread going off course.

Thank you.

Dan
 
 
  • Post #763
  • Quote
  • Jan 22, 2010 3:29pm Jan 22, 2010 3:29pm
  •  coolshades
  • | Joined Nov 2006 | Status: very junior member | 1,576 Posts
for anyone?

i have exited my AH usdchf for a few measly pips. will wait for next week to see what gives.
 
 
  • Post #764
  • Quote
  • Jan 23, 2010 9:28am Jan 23, 2010 9:28am
  •  bluehorizon
  • | Joined Feb 2009 | Status: Member | 45 Posts
Quoting coolshades
Disliked
for anyone?

i have exited my AH usdchf for a few measly pips. will wait for next week to see what gives.
Ignored
no.. messy week... 80 pip loss on nzudusd, 50 pip loss on audjpy (trailed up maybe too soon).. looking for AH if doesn't break support convincingly
 
 
  • Post #765
  • Quote
  • Jan 24, 2010 10:03am Jan 24, 2010 10:03am
  •  DanUK
  • Joined Nov 2008 | Status: You must obey the dance commander | 2,038 Posts
Quoting vicky_ag
Disliked
Dan , I just found your thread abt a day or two ago while skimming through Jacko's thread. I havent tried trading this on daily. I will try for sure if I can find a setup which looks gud.

BTW, while looking at trades on daily should we include the confluence of the fibs (50%) with the TL ?? Or are we looking at just TLs to trade off?
Ignored
Hi Vicky,

Sorry I missed your question earlier. I am generally looking to trade off of price reactions at horizontal support/resistance areas and I use both the 50% level and TLs as a guide to which s/r level to look at.

Regards,

Dan
 
 
  • Post #766
  • Quote
  • Jan 24, 2010 10:05am Jan 24, 2010 10:05am
  •  DanUK
  • Joined Nov 2008 | Status: You must obey the dance commander | 2,038 Posts
Quoting coolshades
Disliked
for anyone?

i have exited my AH usdchf for a few measly pips. will wait for next week to see what gives.
Ignored
Hi Coolshades,

Not been a particularly good week however I did get back in on the G/U short after the daily shooting star formation. Sold at 1.6300 (100 pip stop) and have moved my stop to 1.6200.

Regards,

Dan
 
 
  • Post #767
  • Quote
  • Jan 24, 2010 10:25am Jan 24, 2010 10:25am
  •  castlerock
  • | Joined Sep 2009 | Status: Member | 108 Posts
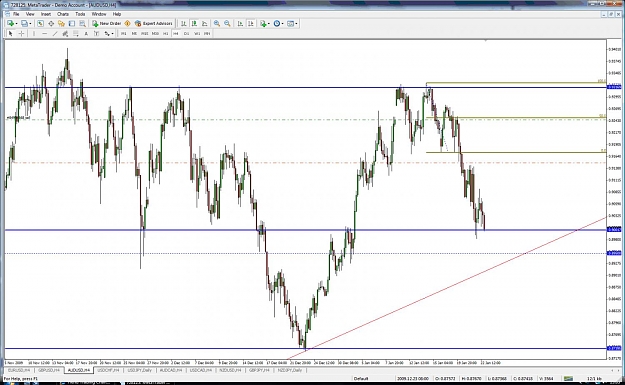
Not a bad week if we remember to use horizontal support/Resistance. a couple of good trades this week this is one of them aud/usd daily is bullish but it has struggled to break pass the 0.9300 took a sell at 0.9250 not sure if i should post this type of set up i feel i have kept within the main principles of this method i will just make it a one off post I'm just making a small point about horizontal S/R .
Attached Image (click to enlarge)
Click to Enlarge

Name: jjjjjj9.jpg
Size: 152 KB
 
 
  • Post #768
  • Quote
  • Jan 24, 2010 8:51pm Jan 24, 2010 8:51pm
  •  castlerock
  • | Joined Sep 2009 | Status: Member | 108 Posts
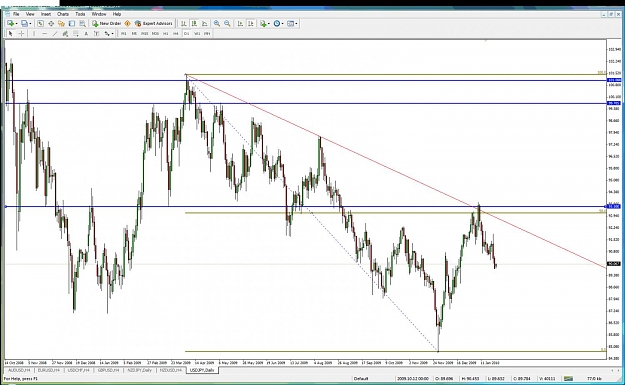
How nice was this one coming off the daily usd/jpy.
Attached Image (click to enlarge)
Click to Enlarge

Name: mmm66.jpg
Size: 156 KB
 
 
  • Post #769
  • Quote
  • Jan 26, 2010 12:53pm Jan 26, 2010 12:53pm
  •  DanUK
  • Joined Nov 2008 | Status: You must obey the dance commander | 2,038 Posts
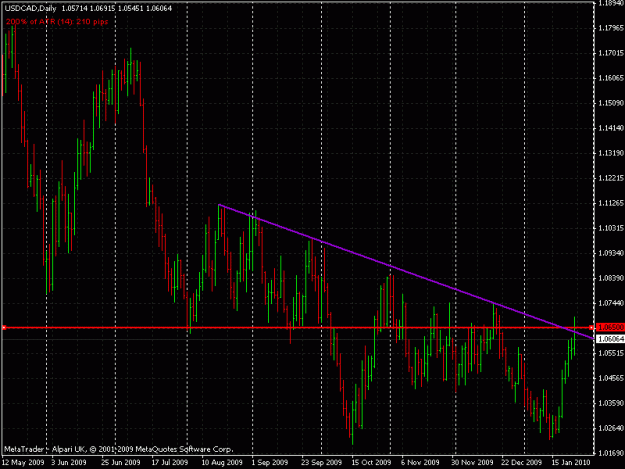
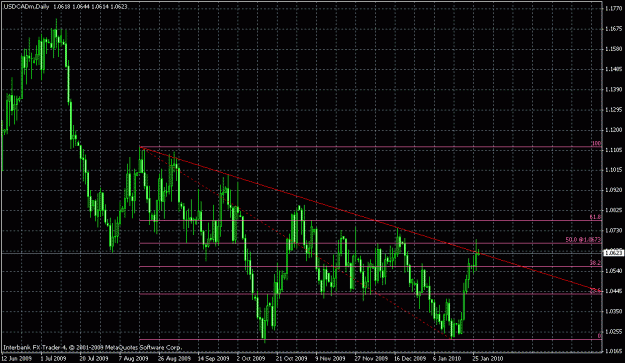
Looks like it's decision time for USD/CAD... if the day closes as a "pin bar" I will be shorting!
Attached Image (click to enlarge)
Click to Enlarge

Name: uc.gif
Size: 24 KB
 
 
  • Post #770
  • Quote
  • Jan 26, 2010 1:38pm Jan 26, 2010 1:38pm
  •  shotshell
  • | Joined Sep 2006 | Status: Member | 87 Posts
Dan, my chart (attached) seems to be quite different than yours - it clearly shows that the price has closed over the trendline in the last several days -
is the difference significant?
do you know why there would be a diffence in the charts?

& how can I fix it so there is no difference? or should I not change it?

Shotshell
Attached Image (click to enlarge)
Click to Enlarge

Name: usdcad daily.jpg
Size: 189 KB
 
 
  • Post #771
  • Quote
  • Jan 26, 2010 1:44pm Jan 26, 2010 1:44pm
  •  coolshades
  • | Joined Nov 2006 | Status: very junior member | 1,576 Posts
pretty easy to blow up dan's chart and see how he has drawn his trend line and how you have drawn it, i would have thought?

you are missing a vital clue in dan's post and that is not just the trend line, but the confluence of his trend line, the horizontal s/r line and possible pa.


Quoting shotshell
Disliked
Dan, my chart (attached) seems to be quite different than yours - it clearly shows that the price has closed over the trendline in the last several days -
is the difference significant?
do you know why there would be a diffence in the charts?

& how can I fix it so there is no difference? or should I not change it?

Shotshell
Ignored
 
 
  • Post #772
  • Quote
  • Jan 26, 2010 1:46pm Jan 26, 2010 1:46pm
  •  DanUK
  • Joined Nov 2008 | Status: You must obey the dance commander | 2,038 Posts
Quoting shotshell
Disliked
Dan, my chart (attached) seems to be quite different than yours - it clearly shows that the price has closed over the trendline in the last several days -
is the difference significant?
do you know why there would be a diffence in the charts?

& how can I fix it so there is no difference? or should I not change it?

Shotshell
Ignored
Hi Shotshell,

It's not the chart that is different, just the way we have drawn our trendlines. The first high you are drawing from is not the same as the high I have used. The reason for this is that I tend to use two different trendlines... an extreme trendline (which connects the outer most points) and the current trendline (which connects the most recent or "active" highs).

Trendlines are very subjective which is why I also use horizontal support and resistance levels in my analysis.

Regards,

Dan

Edit: coolshades beat me to it!
 
 
  • Post #773
  • Quote
  • Jan 26, 2010 2:02pm Jan 26, 2010 2:02pm
  •  shotshell
  • | Joined Sep 2006 | Status: Member | 87 Posts
Dan & Coolshades - thanks for the quick replies - you guys are absolutely right - don't know why I couldn't see it.

Also, do you feel the horizontal line at 106.5 is more significant than the trendline?

Shotshell
 
 
  • Post #774
  • Quote
  • Jan 26, 2010 2:05pm Jan 26, 2010 2:05pm
  •  DanUK
  • Joined Nov 2008 | Status: You must obey the dance commander | 2,038 Posts
Quoting shotshell
Disliked
Dan & Coolshades - thanks for the quick replies - you guys are absolutely right - don't know why I couldn't see it.

Also, do you feel the horizontal line at 106.5 is more significant than the trendline?

Shotshell
Ignored
Hi Shotshell,

Yes in my opinion the horizontal support/resistance levels are the most important thing in trading. There are many ways to trade them and the use of trendlines, fib levels and price action setups (pin bars etc) help to identify the levels to trade from.

Regards,

Dan
 
 
  • Post #775
  • Quote
  • Jan 26, 2010 2:22pm Jan 26, 2010 2:22pm
  •  castlerock
  • | Joined Sep 2009 | Status: Member | 108 Posts
Hi dan looking at the same area lot of resistance at the 700/750 area just wait and see now.
Attached Image (click to enlarge)
Click to Enlarge

Name: caddy2.jpg
Size: 139 KB
 
 
  • Post #776
  • Quote
  • Jan 26, 2010 2:24pm Jan 26, 2010 2:24pm
  •  coolshades
  • | Joined Nov 2006 | Status: very junior member | 1,576 Posts
quick reply since i dont seem to have anything else to do this evening.


i think you will find that a reason why jacko and later dan use the 50% fib in their trading style is because the 50% fib coincides with horizontal s/r lines a lot many times.

Quoting DanUK
Disliked
Hi Shotshell,

Yes in my opinion the horizontal support/resistance levels are the most important thing in trading. There are many ways to trade them and the use of trendlines, fib levels and price action setups (pin bars etc) help to identify the levels to trade from.

Regards,

Dan
Ignored
 
 
  • Post #777
  • Quote
  • Jan 26, 2010 2:26pm Jan 26, 2010 2:26pm
  •  coolshades
  • | Joined Nov 2006 | Status: very junior member | 1,576 Posts
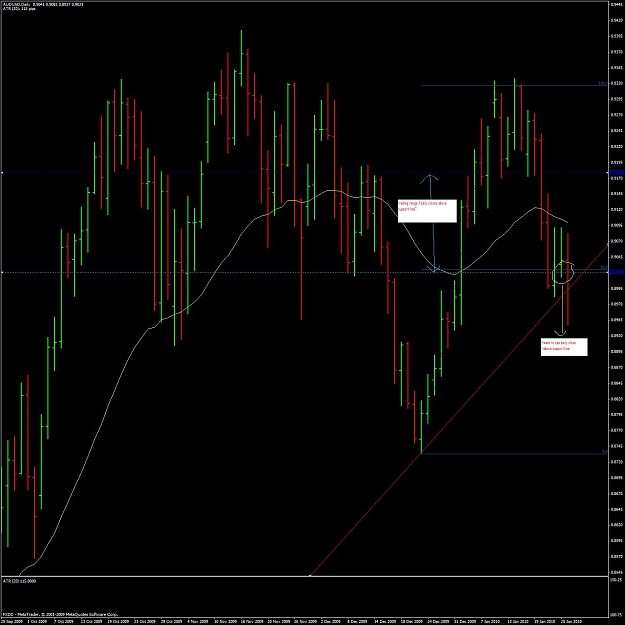
something else i am watching tonite.
Attached Image (click to enlarge)
Click to Enlarge

Name: audusd_26_jan.jpg
Size: 154 KB
 
 
  • Post #778
  • Quote
  • Edited 6:08pm Jan 26, 2010 4:33pm | Edited 6:08pm
  •  bazooki
  • | Joined Jul 2009 | Status: Member | 60 Posts
Quoting coolshades
Disliked
something else i am watching tonite.
Ignored
i'm thinking a bit more downside to come (markets not that convincing today * just a feeling * also waiting for E/U to touch 1.4, N/U double bottom on daily?), but yes, from TA perspective this is certainly an area to watch. horizontal support at 0.8900-0.8950 area

edit: E/U @ 1.4 would be at a weekly 50% fib (april09 low - dec09 high)
 
 
  • Post #779
  • Quote
  • Jan 26, 2010 10:35pm Jan 26, 2010 10:35pm
  •  carrot_yuli
  • | Joined May 2009 | Status: Member | 92 Posts
watching this pain too... Price close below TL and 50%fibo.
Attached Image (click to enlarge)
Click to Enlarge

Name: trade 2 da.gif
Size: 26 KB
 
 
  • Post #780
  • Quote
  • Jan 26, 2010 11:02pm Jan 26, 2010 11:02pm
  •  bazooki
  • | Joined Jul 2009 | Status: Member | 60 Posts
Quoting carrot_yuli
Disliked
watching this pain too... Price close below TL and 50%fibo.
Ignored
personally, I wouldn't draw a daily fib that way, the starting point is "too far". I wouldn't really consider it a daily swing.

but still an interesting area, it spiked through a strong descending trendline (as drawn in your chart). watching this also.
 
 
  • Interactive Trading
  • /
  • Trend Trading Chart Thread
  • Reply to Thread
    • 1 3738Page 394041 107
    • 1 Page 39 107
0 traders viewing now
  • More
Top of Page
  • Facebook
  • Twitter
About FF
  • Mission
  • Products
  • User Guide
  • Media Kit
  • Blog
  • Contact
FF Products
  • Forums
  • Trades
  • Calendar
  • News
  • Market
  • Brokers
  • Trade Explorer
FF Website
  • Homepage
  • Search
  • Members
  • Report a Bug
Follow FF
  • Facebook
  • Twitter

FF Sister Sites:

  • Metals Mine
  • Energy EXCH
  • Crypto Craft

Forex Factory® is a brand of Fair Economy, Inc.

Terms of Service / ©2023