• Home
  • Forums
  • Trades
  • News
  • Calendar
  • Market
  • Brokers
  • Login
  • Join
  • User/Email: Password:
  • 1:05am
Menu
  • Forums
  • Trades
  • News
  • Calendar
  • Market
  • Brokers
  • Login
  • Join
  • 1:05am
Sister Sites
  • Metals Mine
  • Energy EXCH
  • Crypto Craft

Options

Bookmark Thread

First Page First Unread Last Page Last Post

Print Thread

Similar Threads

Are you a trend trader or a counter-trend trader? 29 replies

Trading bounces off daily chart trend lines 13 replies

Trend trading with 55EMAs on the Daily Chart 10 replies

Is Grid Trading (combined trend following and counter trend) Profitable? 3 replies

Using trend on 1hr chart for trading on 15m chart 0 replies

  • Interactive Trading
  • /
  • Reply to Thread
  • Subscribe
  • 583
Attachments: Trend Trading Chart Thread
Exit Attachments
Tags: Trend Trading Chart Thread
Cancel

Trend Trading Chart Thread

  • Last Post
  •  
  • 1 3940Page 414243 107
  • 1 Page 41 107
  •  
  • Post #801
  • Quote
  • Jan 28, 2010 9:17pm Jan 28, 2010 9:17pm
  •  MktScape
  • | Joined Nov 2009 | Status: Member | 780 Posts
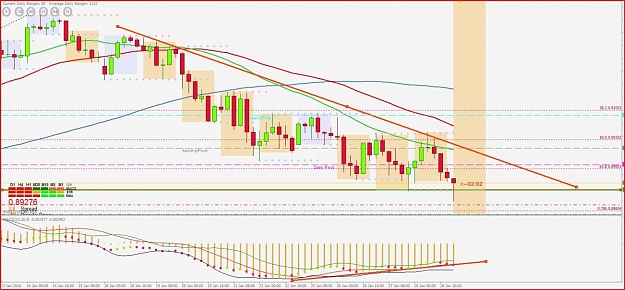
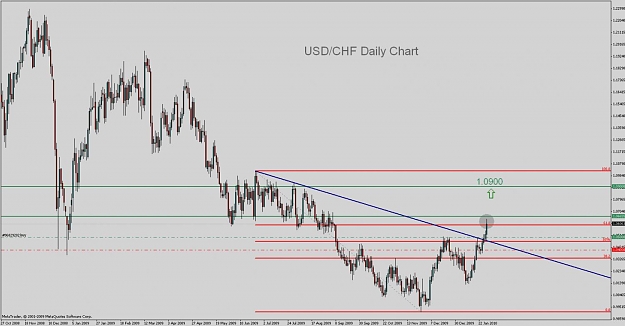
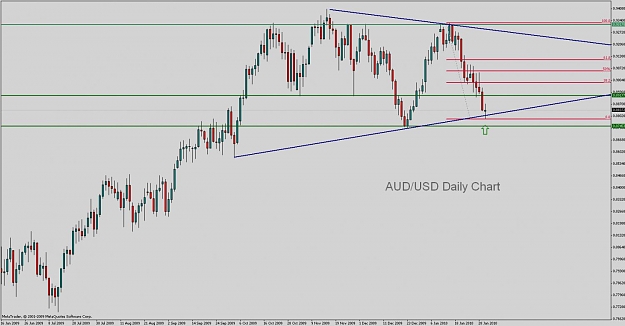
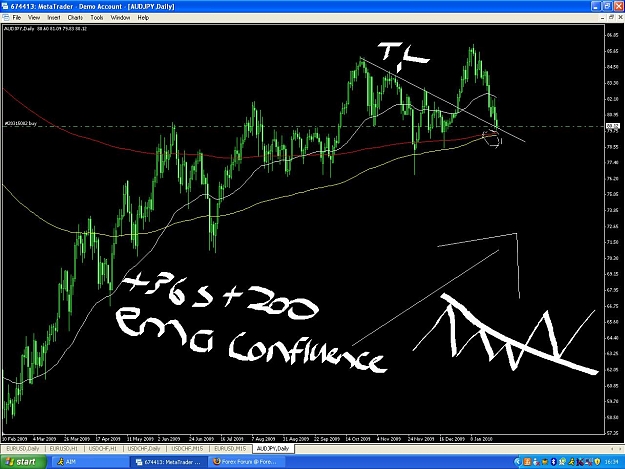
Thanks dear ...i figured that later....I am in this trade as well....Today's daily bar is trying to restest the resistence level ...since this resistance level was tested twice on daily so i feel that it will hold below that level ... I hope it dosent poke into the stop loss ... it is little above the resitance

lets see what happens!

Quoting coolshades
Disliked
dan placed his entry on pin bar.
Ignored
 
 
  • Post #802
  • Quote
  • Jan 28, 2010 10:05pm Jan 28, 2010 10:05pm
  •  MktScape
  • | Joined Nov 2009 | Status: Member | 780 Posts
Hi Guys,
AUDUSD chart on H4 i would wait a bit more until the trendline in broken to upside and aa potential W formation ...however there are other strong evidence in favour of a potential long here....such as ...Clear divergence on H4 near a support level & near 0.786 fib level (I have started using this fib after reading and watching Robert Miner's trading here uses this level every trade) anyways ...i feel that there is some more sideway movement left on AUDUSD to establish a bottom and reverse...but it does look a good candidate!
Attached Image (click to enlarge)
Click to Enlarge

Name: AUDUSD.jpg
Size: 131 KB
 
 
  • Post #803
  • Quote
  • Jan 29, 2010 6:39am Jan 29, 2010 6:39am
  •  DanUK
  • Joined Nov 2008 | Status: You must obey the dance commander | 2,038 Posts
Quoting MktScape
Disliked
Hi Guys,
AUDUSD chart on H4 i would wait a bit more until the trendline in broken to upside and aa potential W formation ...however there are other strong evidence in favour of a potential long here....such as ...Clear divergence on H4 near a support level & near 0.786 fib level (I have started using this fib after reading and watching Robert Miner's trading here uses this level every trade) anyways ...i feel that there is some more sideway movement left on AUDUSD to establish a bottom and reverse...but it does look a good candidate!
Ignored
Hi MktScape,

To be honest I'm not too keen on a long on A/U at the moment. I see more downside potential... possibly heading towards 0.8800... but I could be wrong!!

Regards,

Dan
 
 
  • Post #804
  • Quote
  • Jan 29, 2010 8:34am Jan 29, 2010 8:34am
  •  MktScape
  • | Joined Nov 2009 | Status: Member | 780 Posts
Hi Dan,
I am also in wait & see mode, becuase i feel that a bottom hasnt established as yet .... let see how it behaves.

Quoting DanUK
Disliked
Hi MktScape,

To be honest I'm not too keen on a long on A/U at the moment. I see more downside potential... possibly heading towards 0.8800... but I could be wrong!!

Regards,

Dan
Ignored
 
 
  • Post #805
  • Quote
  • Jan 31, 2010 1:07pm Jan 31, 2010 1:07pm
  •  Xj8
  • | Joined Sep 2009 | Status: Member | 130 Posts
A few trades taken along the way last week, still running and becoming difficult to keep track of, I have also posted my reasons for each entry.

Starting with the GBP/USD, I missed the inverted head and shoulders for a buy, as price moved up, it headed for the third touch off the TL, I measured the distance with a fib from the second point of the TL and this took the third point to 61.8%, my prefference is a 50% fib, as price moved back down through the TL it was safe to say it was a brief breakout.

price again moved back towards the upper TL (4th touch) where a perfect 50% retrace from the previous recent high and a round number, 1.6250, I entered on the bounce.
Attached Image (click to enlarge)
Click to Enlarge

Name: gbpusd 4hr.jpg
Size: 108 KB
 
 
  • Post #806
  • Quote
  • Jan 31, 2010 1:19pm Jan 31, 2010 1:19pm
  •  Xj8
  • | Joined Sep 2009 | Status: Member | 130 Posts
This was an odd one for me, normally I would trade from a TL, this time I chanced my arm after price moved towards the 50% fib, Jacko once gave statistics regarding the TL's and Fibs, if the Fib did not hold price would then make its way to the next TL.

Price did indeed break through it for a bit, then retraced back up to it, it then acted as resistance, and started to head down towards the TL, I sold at 0.9012 and expect to take profit at 0.8824, I may wait until I see what happens at the TL, I have a sneaky feeling it could go through. If so, then the next logical stopping point would be 0.8740, move out to the daily and 0.8600 is achievable.

Whatever happens, I'll be keeping my eye on it.
Attached Image (click to enlarge)
Click to Enlarge

Name: audusd 4hr.jpg
Size: 114 KB
 
 
  • Post #807
  • Quote
  • Jan 31, 2010 1:24pm Jan 31, 2010 1:24pm
  •  Xj8
  • | Joined Sep 2009 | Status: Member | 130 Posts
Just took a trade on Friday, I was possessed, I don't really have any good reason other than it's passed through a strong S&R level, saying that 0.6978 could be a stopping point.

Hopefully it will byepass this and aim for the lower TrendLine close to 0.6884.

I'll just put this down to experimental as it has few characteristics defined in Dan's system.
Attached Image (click to enlarge)
Click to Enlarge

Name: nzdusd 4hr.jpg
Size: 95 KB
 
 
  • Post #808
  • Quote
  • Jan 31, 2010 2:30pm Jan 31, 2010 2:30pm
  •  Xj8
  • | Joined Sep 2009 | Status: Member | 130 Posts
I had to move down to look for an sell entry in the 1 hour time frame, 4 hour was rather steep, though still ok to trade from.

There were several entry levels, once I found a level that was continuously being tested I paired it up with a Fib, the first fib took a retracement to 61.8% bang on the trendline, (first selling point), an entry at round number 128.00 sealed the deal. If I had missed that, there were two other points that would allow me into the sell, the second point was just above 61.8% and the third pushed too far to be comfortable, however, still tradeable as the last two points were at round numbers.
Attached Image (click to enlarge)
Click to Enlarge

Name: eurjpy 1hr.jpg
Size: 93 KB
 
 
  • Post #809
  • Quote
  • Jan 31, 2010 2:39pm Jan 31, 2010 2:39pm
  •  Xj8
  • | Joined Sep 2009 | Status: Member | 130 Posts
This was a breakout from an inner trendline, moving down to the 4 hour I saw a retest of the trendline and took the trade when it started moving back up.

Entered at 1.0500 and I'm swithering staying in as it is hovering around the 61.8% retrace, and a reasonable S&R level just ahead at 1.0665, if it does not turn around here, I may be pushing the boat out and expect it to move to 1.0900.

At the moment it's a free trade being at break even. And it is only on a demo trade, I have still to move my SL though, missed it being away on Friday.
Attached Image(s) (click to enlarge)
Click to Enlarge

Name: usdchf daily.jpg
Size: 101 KB
Click to Enlarge

Name: usdchf 4hr.jpg
Size: 102 KB
 
 
  • Post #810
  • Quote
  • Jan 31, 2010 2:45pm Jan 31, 2010 2:45pm
  •  Xj8
  • | Joined Sep 2009 | Status: Member | 130 Posts
Not looked much into this pair, inner trendline broken, first major stopping point for me is, 1.08500, though we may see a little stumbling around 1.0700.

The 4 hour shows that trendline being tested before moving away from it.

I'm not in any trade here, just an observer.
Attached Image(s) (click to enlarge)
Click to Enlarge

Name: usdcad daily.jpg
Size: 96 KB
Click to Enlarge

Name: usdcad 4hr.jpg
Size: 92 KB
 
 
  • Post #811
  • Quote
  • Jan 31, 2010 3:51pm Jan 31, 2010 3:51pm
  •  supermatt
  • | Joined Jun 2009 | Status: Member | 463 Posts
thanks alot for the charts and your commentary with them xj8. found them to be very helpful
 
 
  • Post #812
  • Quote
  • Feb 1, 2010 7:49am Feb 1, 2010 7:49am
  •  Xj8
  • | Joined Sep 2009 | Status: Member | 130 Posts
Daily Chart

Now that the weekend has settled down and the overnight orders have caught up, looking at the GU now, has seen the bears testing this lower trendline, I'm also aware of the round number 1.5850 just below the trendline, it reasonable to say that there could be a tussle between buyers and sellers here.

If the trendline does not hold and the the round number fails also, then I would be looking for this move to continue down to 1.5750, historical data shows it encouraged the buyers to gain some lost ground, it may do so again.

4 Hour Chart

Dropping down to the 4 hour, one 4 hour candle has closed below the trendline and the other is pushig up from the round number (1.5850) and retesting the trendline, still in its infancy and anything can happen at this point. I'll be watching to see if this candle closes above the TL or below the RN. If it closes significantly below, then a move to 1.5750 looks on.
Attached Image(s) (click to enlarge)
Click to Enlarge

Name: gbpusd daily 122010.jpg
Size: 93 KB
Click to Enlarge

Name: gbpusd 4hr 122010.jpg
Size: 93 KB
 
 
  • Post #813
  • Quote
  • Feb 1, 2010 8:14am Feb 1, 2010 8:14am
  •  Xj8
  • | Joined Sep 2009 | Status: Member | 130 Posts
Daily Chart

Daily trendline is currently being tested, last stopping point on the way down was also 0.8745, a combination of them both may see off the advances of the sellers at this point.I'm looking to see if this will encourage a move up, if so, then possibly to 0.9055 (50% retrace of the last move down) if it passes the 50% point then it will head for the upper trendline.

It's a third touch off the TL, they tend to bounce on a high percentage of the time, so I'm basing a demo buy trade on that theory, there is also the added advantage of the trend direction being in its favour.

4 Hour Chart

This shows a close below the trendline, but it is not significant, the last three one hour candles (at time of posting) are all heading up, so this TL could very well hold, 0.9050 for me, could be the first target for the buyers (approximate region of the 50% retrace).

These are just thoughts that run around my head, if they match up with yours all the better, don't trade on what I say, trade on your own plan, that's my disclaimer out the way, lol.
Attached Image(s) (click to enlarge)
Click to Enlarge

Name: audusd daily 122010.jpg
Size: 91 KB
Click to Enlarge

Name: audusd 4hr 122010.jpg
Size: 101 KB
 
 
  • Post #814
  • Quote
  • Feb 1, 2010 11:33am Feb 1, 2010 11:33am
  •  Xj8
  • | Joined Sep 2009 | Status: Member | 130 Posts
Since posting the two currency pairs above, I have since entered long on both of them, I am cautious due to the direction of the trend on both of them, but they are worth trading to at least the 50% retrace levels, approx 1.0650 on The GU and 0.8990 on the AU (actually this is only a 38.2 retrace level), once price reaches these levels I'll assess how to continue.
Attached Image(s) (click to enlarge)
Click to Enlarge

Name: gu 122010.jpg
Size: 104 KB
Click to Enlarge

Name: au 122010.jpg
Size: 111 KB
 
 
  • Post #815
  • Quote
  • Feb 1, 2010 4:02pm Feb 1, 2010 4:02pm
  •  supermatt
  • | Joined Jun 2009 | Status: Member | 463 Posts
i was thinking this on au, but I try to tell myself to actually wait for a longer term retrace and stay out of the shorter 4hour retraces which is obviously nowhere near as big as the 50% retrace xj8 was pointing out on aus/usd.

what do you think? 4 hour tl abit to steep in the downward direction to warrent a continuation of this mini trend?
Attached Image (click to enlarge)
Click to Enlarge

Name: 2010-02-02_0728.png
Size: 44 KB
 
 
  • Post #816
  • Quote
  • Feb 1, 2010 4:36pm Feb 1, 2010 4:36pm
  •  Kanderpro
  • Joined Feb 2009 | Status: Member | 1,035 Posts
Quoting supermatt
Disliked
i was thinking this on au, but I try to tell myself to actually wait for a longer term retrace and stay out of the shorter 4hour retraces which is obviously nowhere near as big as the 50% retrace xj8 was pointing out on aus/usd.

what do you think? 4 hour tl abit to steep in the downward direction to warrent a continuation of this mini trend?
Ignored
Hello Supermatt,
I came across this on a James 16 thread summary a few days ago. Its author is mbqb11 - very well respected. Hope it helps / is relevant to you.

"I see the most posts that look something like (and I have done it and still get caught so I am not singling anyone out) "What do you guys think of this Pin? Nose could be bigger, close is a bit off, but the location seems ok."
You get the idea and know the posts. When you have to do that stuff, STOP close that chart and move on. Because you know what the better ones will not have so many ifs/ands/buts about them."
Kan
Thanks for your help, warmth and straight talking Heather.
 
 
  • Post #817
  • Quote
  • Feb 1, 2010 4:47pm Feb 1, 2010 4:47pm
  •  supermatt
  • | Joined Jun 2009 | Status: Member | 463 Posts
lol what the???

im sorry kanderpro but what relevance does this post have to this thread? i think you might be a tad confused... i know i am confused with what your post actually means.. sorry?
 
 
  • Post #818
  • Quote
  • Feb 1, 2010 5:38pm Feb 1, 2010 5:38pm
  •  TGpop
  • | Joined Jan 2010 | Status: Member | 229 Posts
buy the dips
Attached Image (click to enlarge)
Click to Enlarge

Name: forex dt 10.JPG
Size: 150 KB
 
 
  • Post #819
  • Quote
  • Feb 2, 2010 8:55pm Feb 2, 2010 8:55pm
  •  MitchOZ
  • | Joined Jan 2010 | Status: Member | 36 Posts
Quoting supermatt
Disliked
i was thinking this on au, but I try to tell myself to actually wait for a longer term retrace and stay out of the shorter 4hour retraces which is obviously nowhere near as big as the 50% retrace xj8 was pointing out on aus/usd.

what do you think? 4 hour tl abit to steep in the downward direction to warrent a continuation of this mini trend?
Ignored
Hi. Just curious how you get the round numbers to show up on your charts? ie. the dotted lines.
Thanks
 
 
  • Post #820
  • Quote
  • Feb 3, 2010 12:24am Feb 3, 2010 12:24am
  •  supermatt
  • | Joined Jun 2009 | Status: Member | 463 Posts
here is the one i use, just plot in the distance u want between the lines and start it off at a round number so it stays even.

I know dan uses one where it has dotted lines for minor rounds and solid for major rounds but im not sure what that one is.
Attached File(s)
File Type: mq4 SpacedLines.mq4   5 KB | 219 downloads
 
 
  • Interactive Trading
  • /
  • Trend Trading Chart Thread
  • Reply to Thread
    • 1 3940Page 414243 107
    • 1 Page 41 107
0 traders viewing now
  • More
Top of Page
  • Facebook
  • Twitter
About FF
  • Mission
  • Products
  • User Guide
  • Media Kit
  • Blog
  • Contact
FF Products
  • Forums
  • Trades
  • Calendar
  • News
  • Market
  • Brokers
  • Trade Explorer
FF Website
  • Homepage
  • Search
  • Members
  • Report a Bug
Follow FF
  • Facebook
  • Twitter

FF Sister Sites:

  • Metals Mine
  • Energy EXCH
  • Crypto Craft

Forex Factory® is a brand of Fair Economy, Inc.

Terms of Service / ©2023