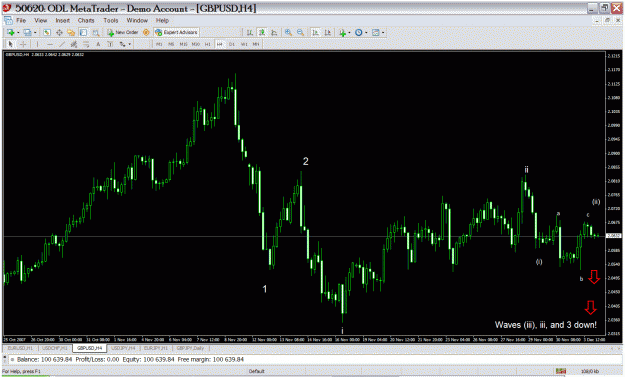
here is a chart on h4.
i put 2 vertical lines: one on the current time, the other one on the last high.
look what happens with CCI and price at the first vertical line: price goes higher, CCI starts to decline. then CCI drops below 0, and price breaks the trendline. THIS IS HOW A REVERSAL SHOULD LOOK, in most cases.
now let's look at the current move: is there any divergence between CCI and price? no. is there any trendline that was broken? no. this points to only one conclusion: the downtrend is not over yet. don't go long unless you scalp some smaller timeframes.
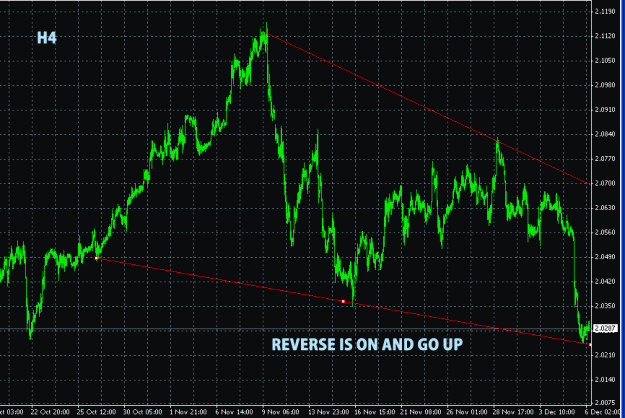
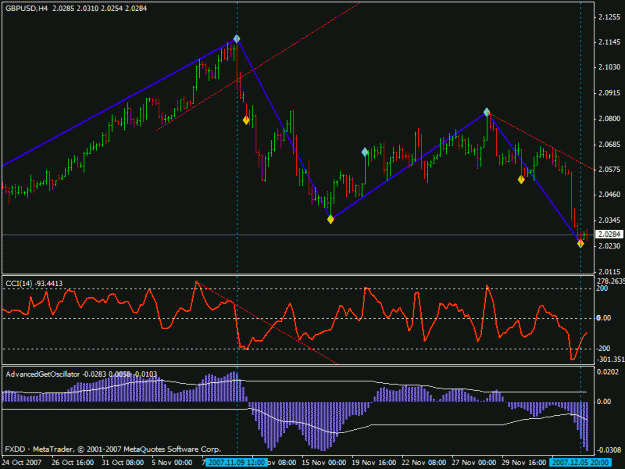
this is what i see on h4 chart.
i put 2 vertical lines: one on the current time, the other one on the last high.
look what happens with CCI and price at the first vertical line: price goes higher, CCI starts to decline. then CCI drops below 0, and price breaks the trendline. THIS IS HOW A REVERSAL SHOULD LOOK, in most cases.
now let's look at the current move: is there any divergence between CCI and price? no. is there any trendline that was broken? no. this points to only one conclusion: the downtrend is not over yet. don't go long unless you scalp some smaller timeframes.
this is what i see on h4 chart.
Attached Image (click to enlarge)
Nihil Sine Deo.