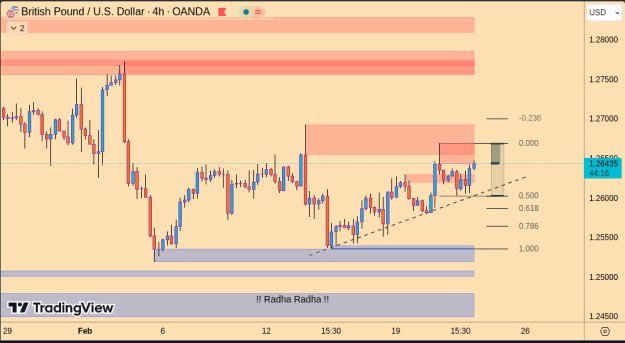
DislikedI'm LONG GU according to the daily chart. since it had broken the triangle trend line, and for many days to back reach FIBO 23.6% 1.26380. but still risky , now the H1 candle is close to the Bollinger upper band. 1.26380 / 1.26530 / 1.26680 are price areas I'll observe the PA. {image}Ignored
4hr and daily bullish.
Weekly chart is on bearish wave to go lower, took out RBS, also LH's but we never know.
UK Gov had a chaotic voting this evening on Gaza's ceasefire, this was unpleasant.
But then inflation reduced by half, rate cuts in June (may be sooner).
Ok I am off, got to go.
2