DislikedGU Daily chart going forward with US Interest Rates on 1st Nove.{image}Ignored
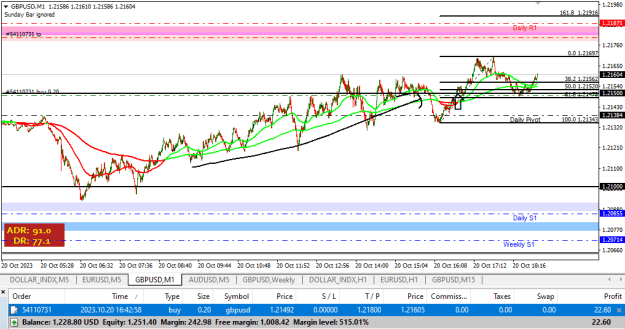
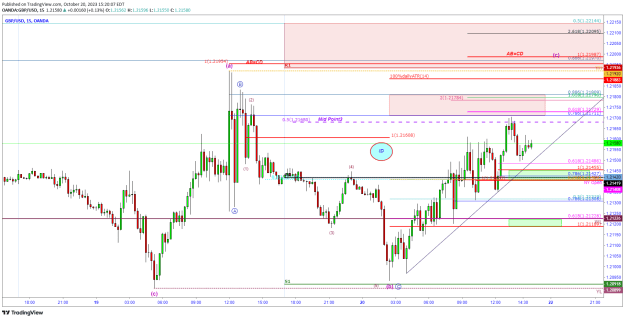
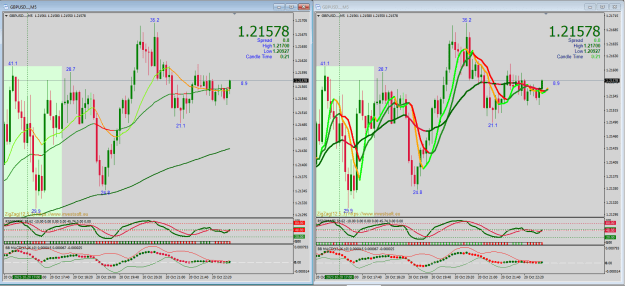
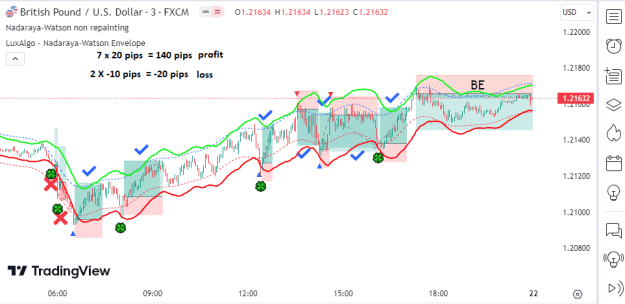
 Cable Update (GBPUSD)
- #784,962
- Oct 20, 2023 1:52pm Oct 20, 2023 1:52pm
- | Membership Revoked | Joined Jun 2011 | 9,885 Posts
To free Gazans of Hamas, use whatever it takes.
- #784,963
- Oct 20, 2023 1:55pm Oct 20, 2023 1:55pm
- Joined Apr 2012 | Status: Stunning | 6,815 Posts
in wondering about yourself, you forgot what you came here to be part of
- #784,964
- Oct 20, 2023 1:59pm Oct 20, 2023 1:59pm
- Joined Dec 2017 | Status: Trader | 30,688 Posts
yes yes yes
- #784,965
- Oct 20, 2023 2:21pm Oct 20, 2023 2:21pm
- Joined Oct 2009 | Status: Trader | 5,686 Posts
Always trade your own plan...I don't provide trading signals.
- #784,966
- Oct 20, 2023 2:25pm Oct 20, 2023 2:25pm
- Joined May 2020 | Status: Best trader ever to exist ever | 10,711 Posts
- #784,968
- Oct 20, 2023 3:34pm Oct 20, 2023 3:34pm
- Joined Oct 2020 | Status: couldn't give a flying duck | 7,388 Posts
- #784,969
- Oct 20, 2023 3:38pm Oct 20, 2023 3:38pm
- Joined Oct 2020 | Status: couldn't give a flying duck | 7,388 Posts
- #784,970
- Oct 20, 2023 3:59pm Oct 20, 2023 3:59pm
- Joined Oct 2020 | Status: couldn't give a flying duck | 7,388 Posts

- #784,971
- Oct 20, 2023 4:06pm Oct 20, 2023 4:06pm
- Joined Oct 2020 | Status: couldn't give a flying duck | 7,388 Posts

- #784,972
- Oct 20, 2023 4:07pm Oct 20, 2023 4:07pm
- Joined Oct 2020 | Status: couldn't give a flying duck | 7,388 Posts

- #784,975
- Oct 20, 2023 6:17pm Oct 20, 2023 6:17pm
- Joined Oct 2010 | Status: Trader | 21,488 Posts
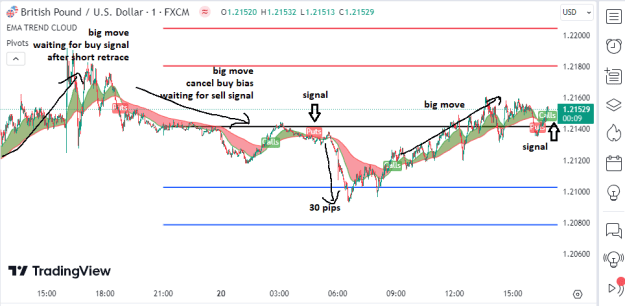
Intraday only.
- #784,976
- Edited Oct 21, 2023 12:39am Oct 20, 2023 9:44pm | Edited Oct 21, 2023 12:39am
- Joined Oct 2010 | Status: Trader | 21,488 Posts
Intraday only.
- #784,977
- Oct 20, 2023 10:18pm Oct 20, 2023 10:18pm
- Joined Oct 2009 | Status: . | 4,038 Posts
Congratulations ScalaFX for coming out of the closet!
- #784,978
- Oct 20, 2023 11:39pm Oct 20, 2023 11:39pm
- Joined May 2020 | Status: Best trader ever to exist ever | 10,711 Posts

- #784,980
- Oct 21, 2023 1:04am Oct 21, 2023 1:04am
- Joined Dec 2017 | Status: Trader | 30,688 Posts
yes yes yes