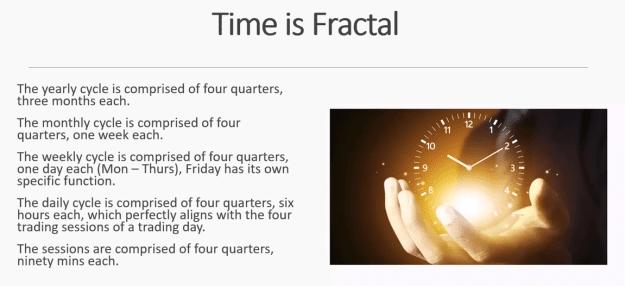
DislikedA final one for Venka if you are out there sir, I didn't reply sorry to your question about the FRACTAL behaviour of the markets. The fractal nature of the markets imo is that similar things happen, which look exactly the same, that occur over most of the chart timeframes. The Trap for traders is that the 'same thing' doesn't always happen across ALL the timeframes AT THE SAME TIME (this is a key to understanding fractals) ie what is happening on a 15m chart and a 1hr chart or a 4hr chart at the same time can be a DIFFERENT directional behaviour....Ignored
It is a repeating pattern that you see in the form of trees. leaves, blood vessels, river deltas, even snowflakes.
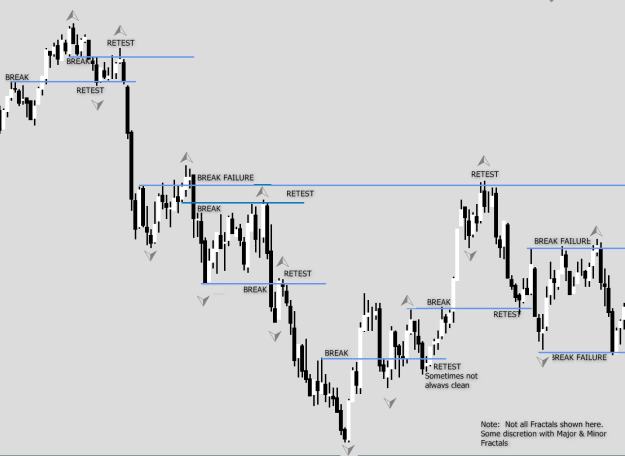
On a chart we see Fractals in the form of Highs & Lows that repeat in all timeframes.
Fractal are defined as a single candle High or Low that has candles each side that have lower highs or Higher Lows forming a peak or trough.
The number of candles to each side in the fractal a pattern is a personal choice, minimum being at least 1 candle each side.
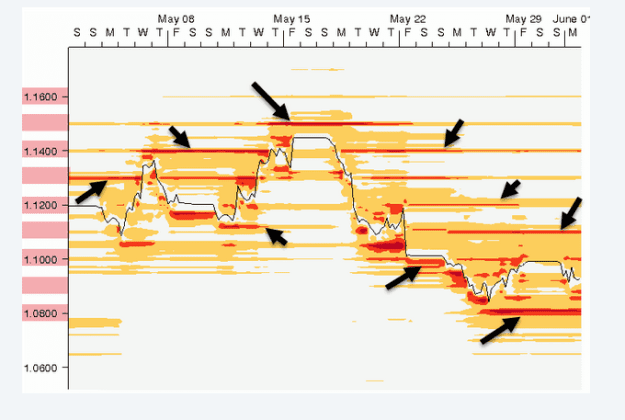
In trading we would pay more attention to a higher timeframe fractal when Price returns back to the same level, where we would expect
some type of reaction to that HTF fractal, and as our strategy dictates we would take action.
If an Uptrend is defined as market making higher highs & higher lows and Downtrend defined as Lower Lows & Lower Highs then :
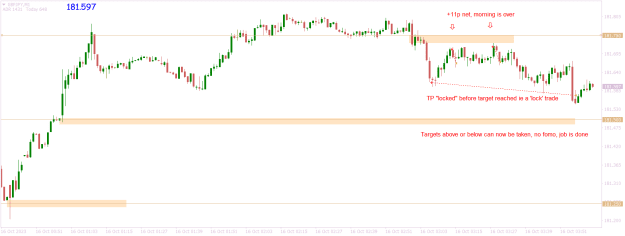
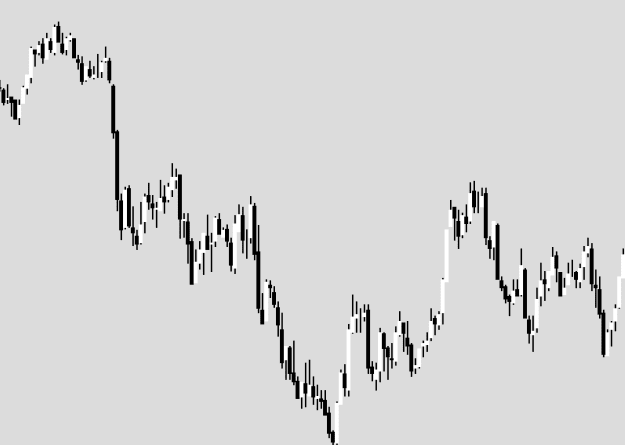
Is this a monthly or 1 minute chart ? Which direction is the price trending and what timeframe, not always the same.
Attached Image (click to enlarge)
It never gets easier, you just get better
4