{quote} Hi Fardeen, why do you exclusively post candle charts then?
Ignored
Hello, idk if there is any rule in the market that said we should only used candle chart or only line chart. We are in the realm of freedom my friend, you can use whatever you seems best for you. Why use only one when you can use both for different analysis on different timeframe?
I use line chart for market structure and trade on candle chart.
More time in the market, does not mean you trade better!
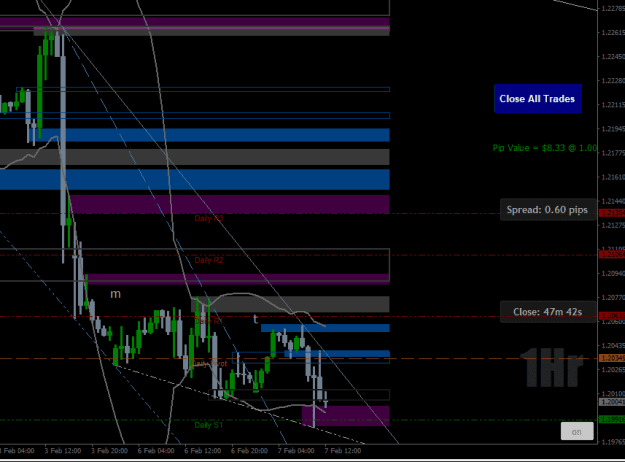
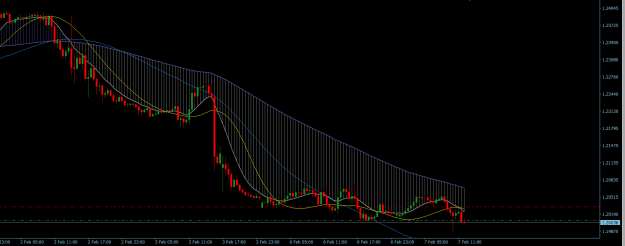
{quote} GBP/USD 30M Went Short at 1.20175 (half lot size, to cover potential loss and because 30M confirmed Short.) SL 20 pips. Risky trade ended badly haha.. Forgot to screenshot..sorry. (I pressed screenshot, but it remained 15M photo..). Anyway.. SL hit at 1.20146 Another short added at 1.20079 (No wick). TP 1.20 for both, perhaps a little lower, we'll see.. {image}
Ignored
Short from 1.20175 TP-ed at 1.20014. The second one at 1.20079 I'll leave for now. Let it run..
GBP/USD 30M (second Short activated due to no wick) 1.20079 SL 1.20329 (25 pips), TP Let it run if it can..
See you later!
Hourly Chart, candle closed below yellow line.
*We could very well see lows of 1.19 today. We'll see..
Sorry for quick change from Long to Short. Whenever chances of this happening are higher then usual, I'll always warn you that trade is risky as I did.
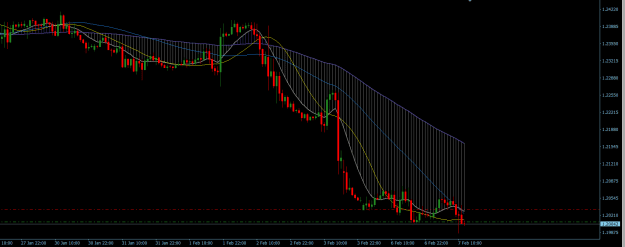
GBP/USD H4 Chart, candle just bounced off of gray line.. until I have at least 15M showing Buy, Bears are in control for today.
GL!
How do we know whether it is a breakout or fakeout? By watching the chart, a fakeout is revealed only when the close is far from the Liquidity level. Is there any trader that can please give an insight on how do we trade fakeout, especially if we are flat
Ignored
I guess it depends on the timeframe u are trading. lower tf means more volatility and ranging, fakeouts.
Personally, a convincing break for me is as u mentioned a close far from "liquidity" or demand/supply level.
A bearish or bullish candlestick pattern helps too.
...conflicting - the last two 1hr closes...take your pick. Price challenging top of prev 30min sw lo zone = prev supp = pot supp, leading down to current dly lo now
1hr & 10/20/50 ema crosses - current state of, below
{quote} So the US can just keep piling on the debt? The money to pay the interest has to come from somewhere. The higher the interest rate, the more money needed to pay the interest on an ever increasing debt. They can either pay it from tax revenues, of which there aren't anywhere near enough tax payers, or they can borrow more and use there new lenders to pay the old lenders, which is a ponzi scheme.
Ignored
Interesting
I'm enjoying the wins because I was once terrified by loses
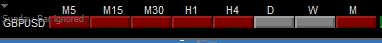
...conflicting - the last two 1hr closes...take your pick. Price challenging top of prev 30min sw lo zone = prev supp = pot supp, leading down to current dly lo now 1hr below {image}
Ignored
thinking we have seen todays high already. Nothing in the pair looking to give the bulls a break. New resistance area 12030 can’t see a break
{quote} thinking we have seen todays high already. Nothing in the pair looking to give the bulls a break. New resistance area 12030 can’t see a break
Ignored
It was certainly a 'fakeout' on the asian hi wasn't it (If I correctly understand what Fardeen1209 means by a 'fakeout' as opposed to beakout?) I don't imagine many sell position stops will have been hit though,? maybe some retail close above the asian hi?
|
Membership Revoked
|
Joined Nov 2022
|1,789 Posts
how hard is it... download upload like light speed matters! might deGrail... need more weapons round up nuts in the UKRAINE clear all tracks CALL MAID .gov canada chop shop sui cide no tanks... no booster mind fuk with the masses... THINK graphic hic ups are a joke enough method actors NATO whatever actors GUILD
Pretty facinating that GBP is being sold like mad against every pair here. When this happens, they risk of capitulation increases. It WILL trade up eventually but if you have stops...i guess you know what happens to them
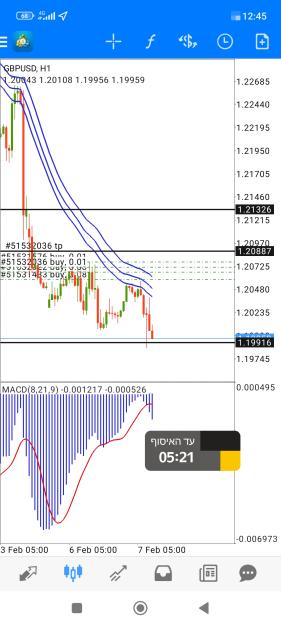
{quote} Short from 1.20175 TP-ed at 1.20014. The second one at 1.20079 I'll leave for now. Let it run.. GBP/USD 30M (second Short activated due to no wick) 1.20079 SL 1.20329 (25 pips), TP Let it run if it can.. See you later! Hourly Chart, candle closed below yellow line. *We could very well see lows of 1.19 today. We'll see.. Sorry for quick change from Long to Short. Whenever chances of this happening are higher then usual, I'll always warn you that trade is risky as I did. GBP/USD H4 Chart, candle just bounced off of gray line.. until I have...
Ignored
Meh.. closed at 1.20023. I'll wait for Wall Street.. again it's weird. Euro going up against USD, Pound.. not dropping? Loss recovered, earned some extra and that's it.
See you later.
Not interested..
(Forget my analysis for today)..
Every TF points Short, but Euro is going up, as said against USD, so waiting for the Pound to drop is just a waste of time in my opinion and I could be very wrong and see Pound at lows of 1.19 later in a day. I guess we'll see later and if Wall Street does anything.
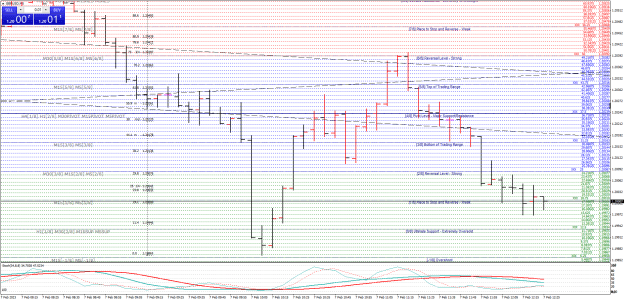
...you don't even need an oscillator (s) to see how the momentum in the down move has slowed relative to the fall from Friday hi (on Friday, albeit data induced.) Just PA shows this for eg... But just because momentum has slowed - this doesn't necessarily mean the down-move is over.
Looking immediately below the current dly lo which sees a prev 30min sw lo zone running down to it, which houses Dly S1 @/around 1991, and a 76.4% downside fib @/around the bottom of it, are:
a. Dly S2 @/around 1962 b. 1956 Mthly S1 c. The next potentially most significant fib to the downside is: 1949 23.6% 0327-2448 d.Prev 1hr/minor 4hr sw hi zone that starts circa 1934-1919 = prev res = pot rbs which houses wkly S1 @/around 1927 and Dly S3 @/around 1919 e.Prev 4hr/dly/minor wkly sw lo zone=prev supp=pot supp that extends on; Wkly - is very wide Dly - circa 1888-1840 4Hr - circa 1855-1840
There are other longer-term downside fibs @ 1928, 1918, and 1866.
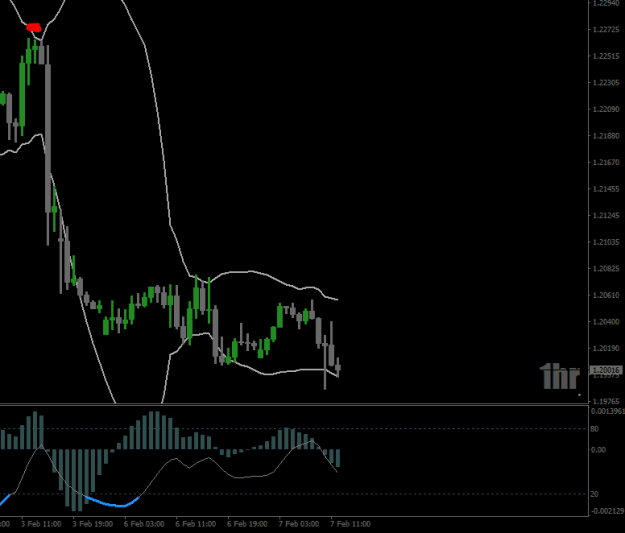
...you don't even need an oscillator (s) to see how the momentum in the down move has slowed relative to the fall from Friday hi (on Friday, albeit data induced.) Just PA shows this for eg... But just because momentum has slowed - this doesn't necessarily mean the down-move is over. Anything can happen 1hr below {image}
Ignored
exactly. The market seems exhausted from the back end of last week. 11950 maybe later a break below opens up lower lows imho. above 121 for a deeper drop the area from 12180 is getting lower. Thinking maybe 121-12120 before the drop.
{quote} exactly. The market seems exhausted from the back end of last week. 11950 maybe later a break below opens up lower lows imho. above 121 for a deeper drop the area from 12180 is getting lower. Thinking maybe 121-12120 before the drop.
Ignored
Thinking what might or might not happen next usually gets us into all sorts of problems lol! Don't think - just follow price!