Disliked{quote} I think you have it in a nutshell. Forget analysis and just run with price action as it happens. I prefer the M1 / M30 combo but add Futures data to show me the when the market orders are confirming momentum direction with increasing volume. No lines, just get them all to agree and trade large for small scalps. Zero analysis is essential because that wasted time is better spend with your family.Ignored
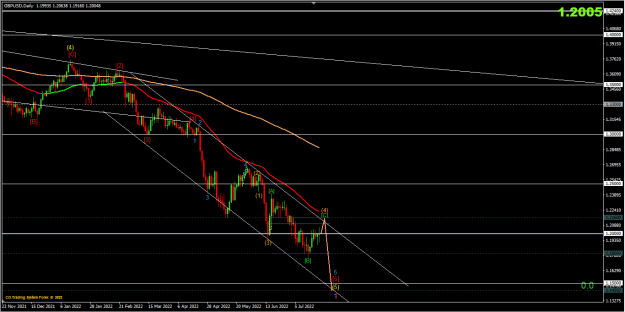
1 min momentum arrow says sell at 2020.
5min sell candle develops around 2014
15 min candle sell develops around 2010.
30 min candle sell prevails already.
SELL. My sell entry at 2010 when 1,5,15,30 min candles coincides.
Potential profit up to 1975. ( 35 pips ! )
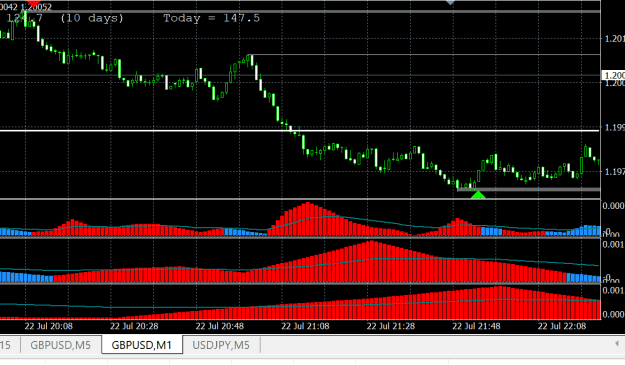
Attached Image (click to enlarge)
Intraday only.
4