Disliked{quote} Thanks for the feedback mate. : - you are right about the double tops so far this year, now this same double top is similar to the double top of year 2018 (1.43) before crash to 1.24 in December that same year 2018. : - as for the October 2016 flash crash low of (1.14) it did connect to 1.43 double top of 1.43 in year 2018, just as Covid/Pandemic inspired low of (1.14) year 2020 also connects to the double top of 1.42 this year 2021 so far. : - As for the previous 10 years, the lowest yearly range of GBPUSD is 1100 pips, which only happened...Ignored
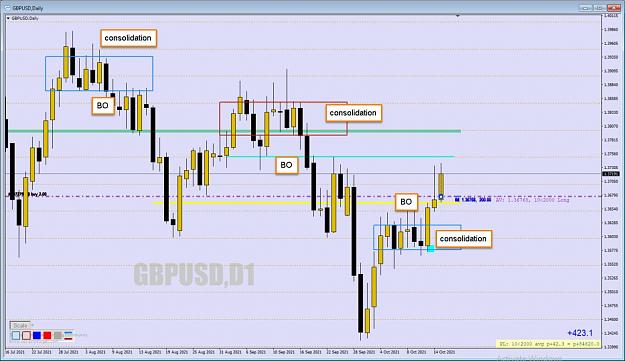
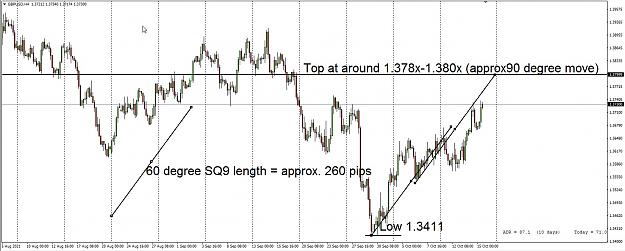
Thanks for sharing those stats and explanations. Yes, from the point of view of the minimum yearly range over the last 10 years being completed this year, getting below 3411 (current yrly lo) to complete it looks easier than getting above 1.4249 (current yrly hi) given where price is right now, and ergo likely makes it more probable, per that range analysis. I completely agree re all analysis being inherently imperfect, including my own. I guess all I am saying is that 'within' that over-riding range analysis, PA (which is what is actually happening) up to the dly t/f is currently not pointing to a downside break of 3411 to complete the min 10 year average range.
Trader with an Edge.
1