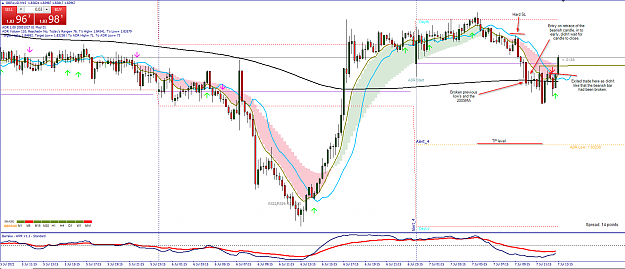
I didn't get around to posting any trades during the day, sorry about that. However, I couldn't sleep tonight so thought I'd discuss a trade as people seem to want to know more about entries, trade management and exits.
The trade itself is nothing special but it does contain quite a few reference points that I think are worth highlighting. I've marked up the chart as follows:
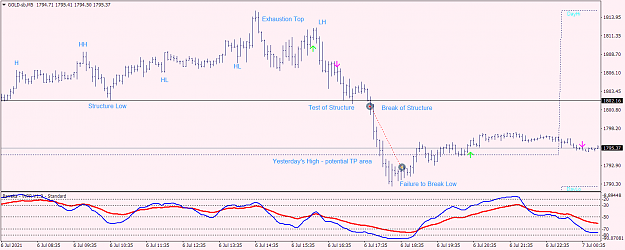
Let's start on the left hand side of the chart. We get a High followed by a Higher High. The trend is still up. The market then makes a Structure Low. By that, I mean the market sold off and then rejected the area and went higher. We now know this area is 'protected'.
As expected in an uptrend, the market confirms the direction by putting in a couple of Higher Lows. Now, the next part takes me back to something I mentioned in passing previously but it probably requires more emphasis so please excuse me for using bold text 'context is everything!' Keep in mind we are in a strong uptrend. What often happens at the end of a strong trend is the market goes from an orderly rise/decline to an exaggerated final push. Otherwise known as an Exhaustion Top or Exhaustion Bottom.
How do we know it's an Exhaustion Top in this case? Well, we don't. Not right away. But we gradually gather the clues. First, the most recent Higher Low is broken. Then we get a Lower High followed by another Lower Low. This should not happen in a healthy uptrend. So, we now believe the tide is turning and there might be a short opportunity. We should jump straight in! Well, no - we really shouldn't. Why? Because of our old friend the Structure Low. We need the market to test it and break it.
We do get the test (twice) of the Structure Low and third time is a charm as it breaks. Some people like to wait for a further re-test from below but I prefer not to risk missing the train so I get in straight away after the break. It then becomes a smooth ride down without much support. However, I was conscious of Yesterday's High sitting just below and realised it was possible the market would react and potentially bounce there.
I watched it closely at that level but it sailed right through, so I stayed in my position. I eventually decided it was time to bail out when I saw two things happening. The market went into a mini consolidation phase (lower highs and higher lows) and then broke that mini consolidation to the upside. That, together with the fact the low held firm, told me the party was over.
Notice that I've not even mentioned Daylight yet. Now let's take another quick look at the sub-window moving averages. The slow moving average went below -50 and the fast moving average stayed under the slow. Perfect conditions for shorting a market. But hopefully you see that, without context, the signal itself isn't enough.
Please let me know if this type of analysis is helpful or not. I'm happy to post a few more examples as the thread progresses if people find it useful.
The trade itself is nothing special but it does contain quite a few reference points that I think are worth highlighting. I've marked up the chart as follows:
Attached Image (click to enlarge)
Let's start on the left hand side of the chart. We get a High followed by a Higher High. The trend is still up. The market then makes a Structure Low. By that, I mean the market sold off and then rejected the area and went higher. We now know this area is 'protected'.
As expected in an uptrend, the market confirms the direction by putting in a couple of Higher Lows. Now, the next part takes me back to something I mentioned in passing previously but it probably requires more emphasis so please excuse me for using bold text 'context is everything!' Keep in mind we are in a strong uptrend. What often happens at the end of a strong trend is the market goes from an orderly rise/decline to an exaggerated final push. Otherwise known as an Exhaustion Top or Exhaustion Bottom.
How do we know it's an Exhaustion Top in this case? Well, we don't. Not right away. But we gradually gather the clues. First, the most recent Higher Low is broken. Then we get a Lower High followed by another Lower Low. This should not happen in a healthy uptrend. So, we now believe the tide is turning and there might be a short opportunity. We should jump straight in! Well, no - we really shouldn't. Why? Because of our old friend the Structure Low. We need the market to test it and break it.
We do get the test (twice) of the Structure Low and third time is a charm as it breaks. Some people like to wait for a further re-test from below but I prefer not to risk missing the train so I get in straight away after the break. It then becomes a smooth ride down without much support. However, I was conscious of Yesterday's High sitting just below and realised it was possible the market would react and potentially bounce there.
I watched it closely at that level but it sailed right through, so I stayed in my position. I eventually decided it was time to bail out when I saw two things happening. The market went into a mini consolidation phase (lower highs and higher lows) and then broke that mini consolidation to the upside. That, together with the fact the low held firm, told me the party was over.
Notice that I've not even mentioned Daylight yet. Now let's take another quick look at the sub-window moving averages. The slow moving average went below -50 and the fast moving average stayed under the slow. Perfect conditions for shorting a market. But hopefully you see that, without context, the signal itself isn't enough.
Please let me know if this type of analysis is helpful or not. I'm happy to post a few more examples as the thread progresses if people find it useful.
1
25