Hi peterhenders , this is a follow up on your post in "Naked Chart Challenge" but unfortunately you were blocked there.
i did a quick tests with your method of trading using the the previous days close as level and i,m really exited about the idea.
Thanks, i will definitely explore this idea futher.
Would appreaciate more chart entrys examples just to gain confidance and check if i understand your method right.
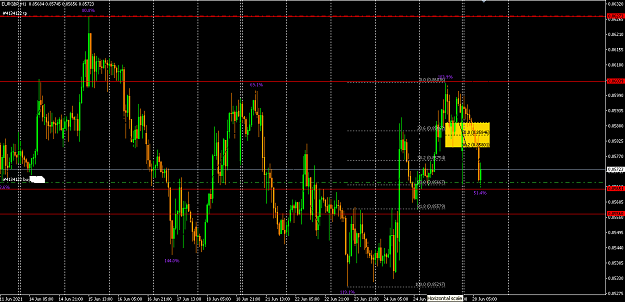
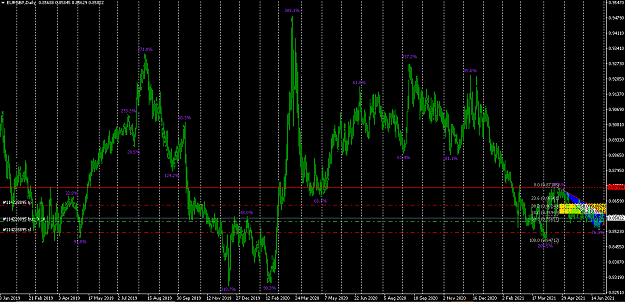
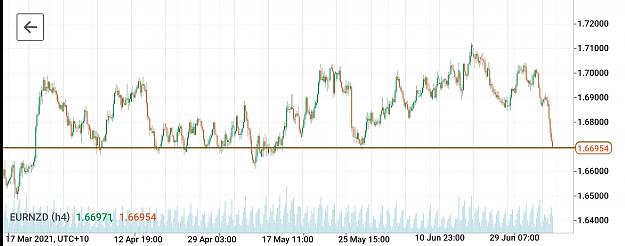
On your EUR Day Chart, price went up on previous candle , came a bit down and closed (Green Candle)
Price then continued down on the last candle (Red Candle )
So as i understand that was the entry for a short.
But you write == The Blue line is the previous days close where we make a long entry when this line is broken
my confusion Long or Short Entry ? Thanks, really appreaciate you time and efford.
i did a quick tests with your method of trading using the the previous days close as level and i,m really exited about the idea.
Thanks, i will definitely explore this idea futher.
Would appreaciate more chart entrys examples just to gain confidance and check if i understand your method right.
On your EUR Day Chart, price went up on previous candle , came a bit down and closed (Green Candle)
Price then continued down on the last candle (Red Candle )
So as i understand that was the entry for a short.
But you write == The Blue line is the previous days close where we make a long entry when this line is broken
my confusion Long or Short Entry ? Thanks, really appreaciate you time and efford.