swing trading gives us the best opportunities to be profitable if we know how to trade...{image}{image}{image}
Ignored
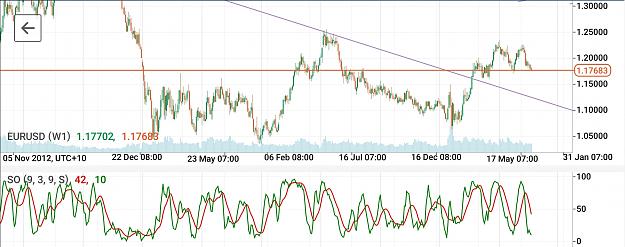
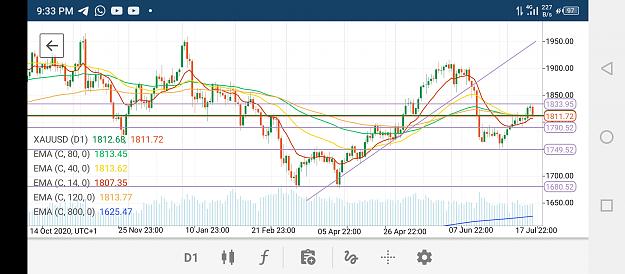
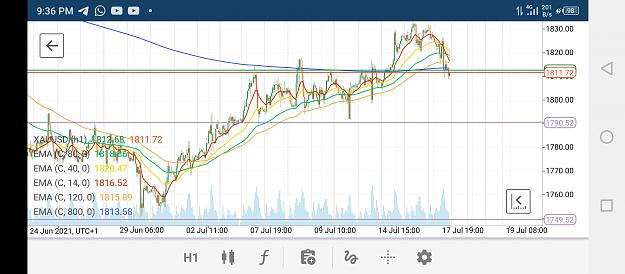
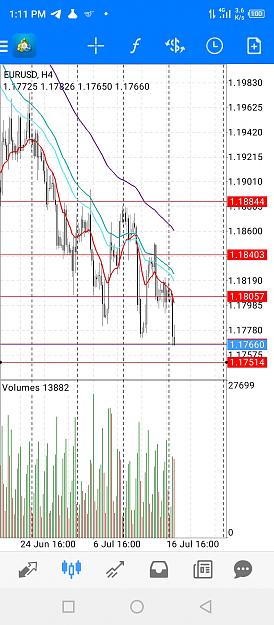
I am looking at gold. It looks like a good swing trade.
On the daily 50% fair value gap was filled and a strong sell off followed at around 1833 region as Indicated by topmost horizontal line on the daily. Liquidity seems to have been grabbed on the retracement move and now some equal lows seen below may act as liquidity pool to drag price down. A close look at the 15min chart shows price reacting to 800 ema but may clear to drop lower instead of retracing since no imbalance to hunt to upside hence price may break the ema and continue down. This may provide a good swing trade selling up to d equal lows 1 and 2 as shown by horizontal lines in my opinion of course and based on how I read price action. Entries would be better on lower tfs. Wishing us happy trading week.
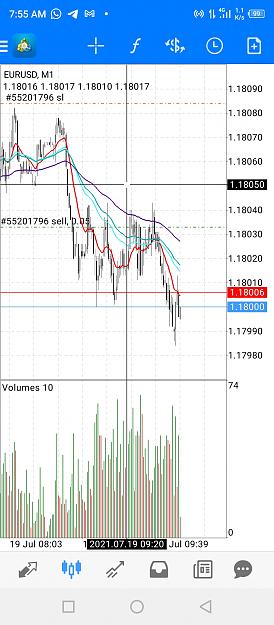
I tried to trade a 5 minute tf bearish breaker i saw at 1812 region. Waited for it to break and retest then I sold, only a micro lot to try out the asian setup find attache image of the entry. Bearish breakers know how to play with emotions and must be handled with care fam. I sold because of d underlying narrative of bearish gold and about to b bullish oil let's see how it plays out
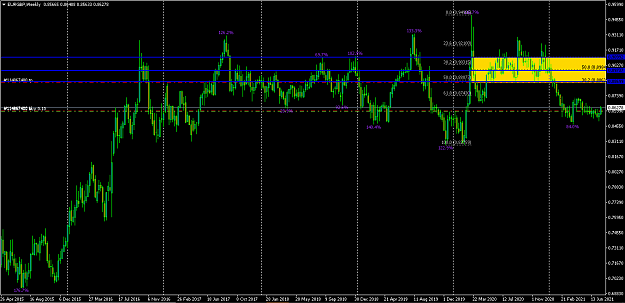
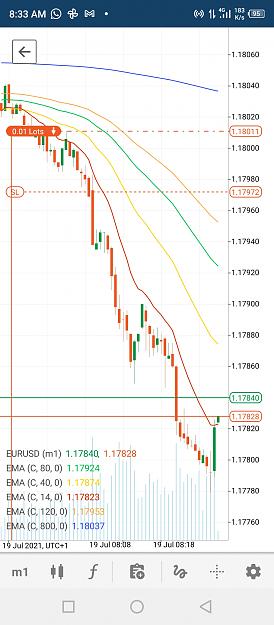
And here is the EU trade I took around the same time with the XAU trade. Price broke was ranging between the 80 and 50 percent key levels and then broke the 50 level, retested and continued down. I analyse pairs independently but bearing in mind that this pair behaves similarly with gold being a foreign currency most of the time but it's much slower. Let's see how far the drop am targeting the equal lows as I marked on previous charts I posted though
{quote} I am looking at gold. It looks like a good swing trade. On the daily 50% fair value gap was filled and a strong sell off followed at around 1833 region as Indicated by topmost horizontal line on the daily. Liquidity seems to have been grabbed on the retracement move and now some equal lows seen below may act as liquidity pool to drag price down. A close look at the 15min chart shows price reacting to 800 ema but may clear to drop lower instead of retracing since no imbalance to hunt to upside hence price may break the ema and continue down....
Ignored
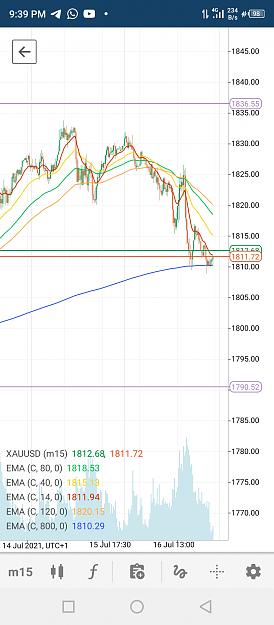
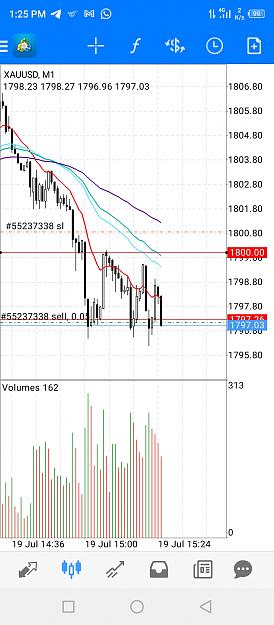
Gold broke the 1800 round value and retested it. It seems it's going to target the equal lows seen clearly on the daily tf
Attached Image (click to enlarge)
image shows as gold broke d 1800 region and also the retest
{quote} I am looking at gold. It looks like a good swing trade. On the daily 50% fair value gap was filled and a strong sell off followed at around 1833 region as Indicated by topmost horizontal line on the daily. Liquidity seems to have been grabbed on the retracement move and now some equal lows seen below may act as liquidity pool to drag price down. A close look at the 15min chart shows price reacting to 800 ema but may clear to drop lower instead of retracing since no imbalance to hunt to upside hence price may break the ema and continue down....
Ignored
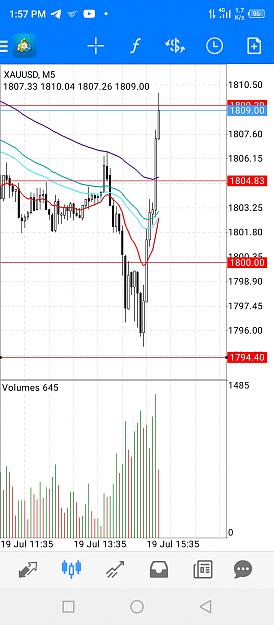
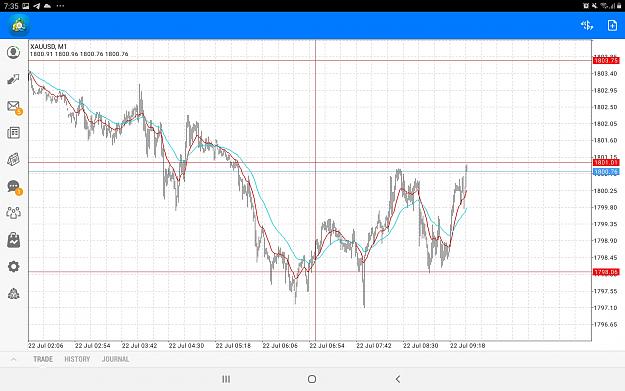
Gold broke the 1800 level and went only 5 pips deeper to reverse liquidating early sellers like myself. But let's see where its heading to I still have a feeling this move is a retracement for a deeper down move to follow.
Lesson learnt. Always remember my lessons to just watch whenever a round value is poked to see the reaction at that region. We learn constantly. I am now waiting to see what happens in a couple of minutes 11:30 am EST in view
{quote} it is all clear n a bit sorry why not tp a bit high usually it always come to fib 38 - 50 but I hv to let it go n I am still curious with this eg, is it will ranging forever {image}
Ignored
My long journey to practise my patient, never surrender on eg seems stable now settle above 86 after keep more than 2 weeks, hope soon 864, 87
{quote} Gold broke the 1800 level and went only 5 pips deeper to reverse liquidating early sellers like myself. But let's see where its heading to I still have a feeling this move is a retracement for a deeper down move to follow. Lesson learnt. Always remember my lessons to just watch whenever a round value is poked to see the reaction at that region. We learn constantly. I am now waiting to see what happens in a couple of minutes 11:30 am EST in view {image}
Ignored
Update
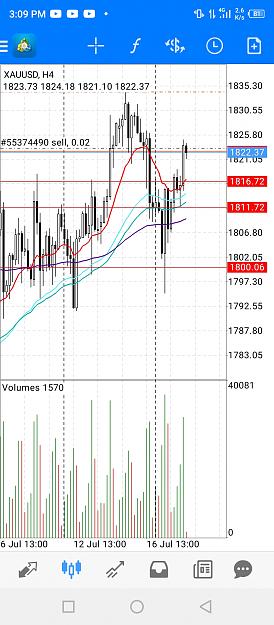
Gold has not moved much since reacting to the 1800 level. It could sell a bit from where it is now. It looks like RTO All eyes on gold
{quote} I am looking at gold. It looks like a good swing trade. On the daily 50% fair value gap was filled and a strong sell off followed at around 1833 region as Indicated by topmost horizontal line on the daily. Liquidity seems to have been grabbed on the retracement move and now some equal lows seen below may act as liquidity pool to drag price down. A close look at the 15min chart shows price reacting to 800 ema but may clear to drop lower instead of retracing since no imbalance to hunt to upside hence price may break the ema and continue down....
Ignored
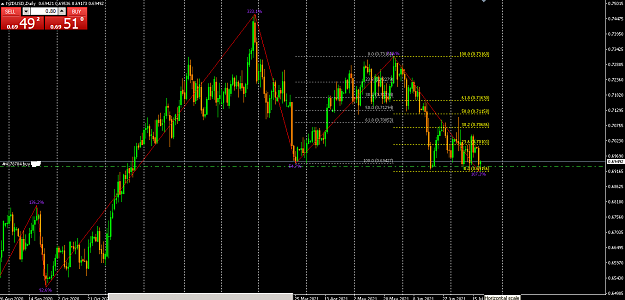
EJ
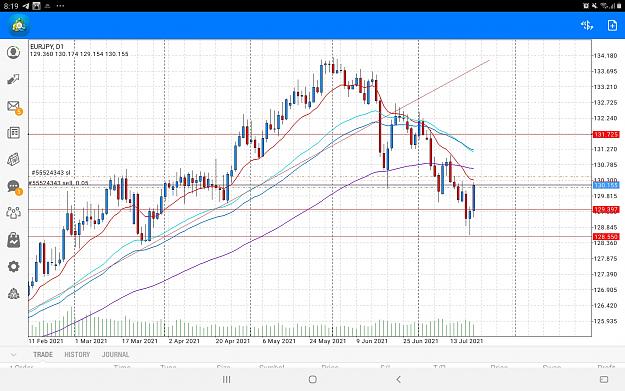
EJ looks interesting. It looks like RTO to bearish OB? lets see. Gold has been battling around 1800 round value. Fingers crossed to see if it will break and retest a 2nd time. EU is also selling g but dealing with major resistance
{quote} EJ EJ looks interesting. It looks like RTO to bearish OB? lets see. Gold has been battling around 1800 round value. Fingers crossed to see if it will break and retest a 2nd time. EU is also selling g but dealing with major resistance{image}
Ignored
EJ could be revisiting a higher OB. I will wait for that region to re enter. The secret is always work to protect equity
Attached Image (click to enlarge)
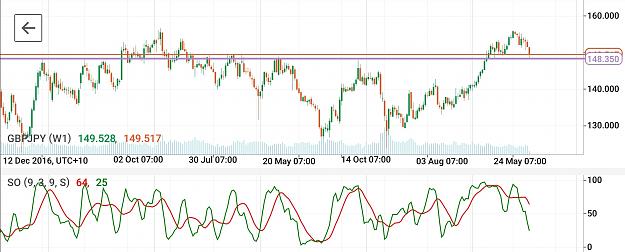
so then way I see it a hammer printed on the weekly chart may cause the movement to challenge the OB at the origin. Let's observe
{quote} EJ EJ looks interesting. It looks like RTO to bearish OB? lets see. Gold has been battling around 1800 round value. Fingers crossed to see if it will break and retest a 2nd time. EU is also selling g but dealing with major resistance{image}
Ignored
Update
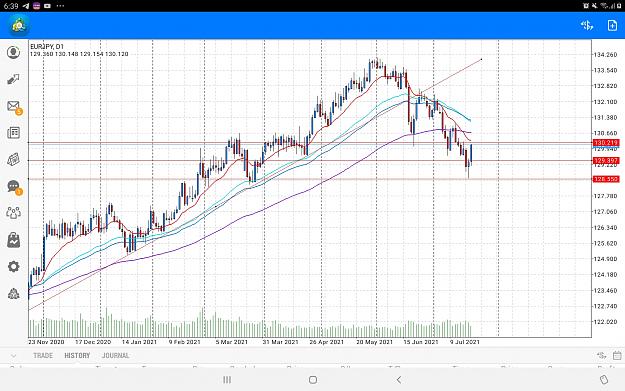
EU seems bullish now. I just saw these. Rto to bullish monthly OB Let's be careful selling other correlated pairs but I still see EJas retracing to OB at origin let's seeAttachment gAttachment g
{quote} Update EU seems bullish now. I just saw these. Rto to bullish monthly OB Let's be careful selling other correlated pairs but I still see EJas retracing to OB at origin let's see39948963994897
Ignored
Buying Eu.
Price seemed to open bullish considering the asian RANGE. Set up was clearer in gold and eventhough I like to look at charts separately we cant deny that some level of correlation exists. Let's keep studying hard guys