DislikedQuestion: this is a sell signal right? ---- this is a sell signal right > Yes Apply post#647 before placing a trade. How many of BigE's post can be apply to that TDI cross over? #2.... 1st Trading Chart... Note on the TDI showing your entry set ups... green crossing red enter on that new PA candle #6.... We Enter a trade when green crosses red on the TDI at the beginning of that candle... If it's candle 3 or more don't enter... find another trade set up. The only exception is if green bounces off red and continues... it's ok to re-enter on the bounce......Ignored
hi Johnwerks
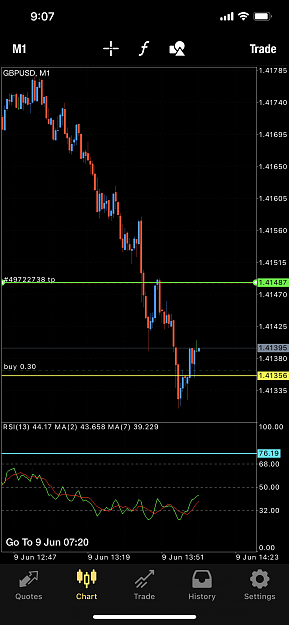
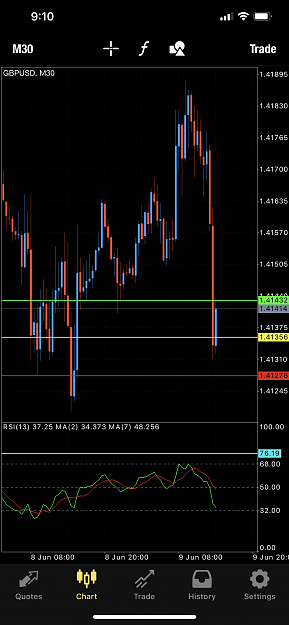
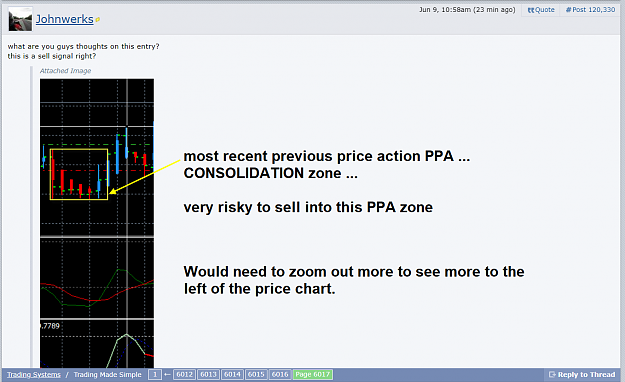
Please post a full size chart again.
There is no TMS 5-Method trade setup on that small chart.
You cannot make trade decision based on that small amount of chart with so few price bars and HA candles.
the 5EMA typical Price, Shift+2 is not on your chart.
To make a trade decision, you need to zoom out on that chart so that you can see more of the market type conditions with your knowledge of Post#647.
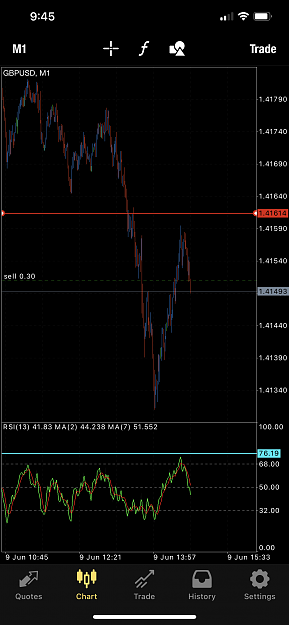
A trade setup at that point must show a True REVERSAL candle which must have
1) a Stochastics (8,3,3) cross signal, then
2) the TDI RSI green price line must show there is price MOMENTUM is the setup candle.
I don't see both 1) and 2)
What I see is the most recent previous price action PPA is a Price Consolidation zone and your vertical line marks another consolidation zone. Doesn't look good at all based on such small part of a chart.
Attached Image (click to enlarge)
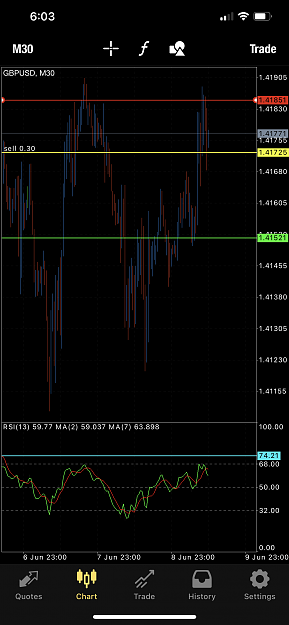
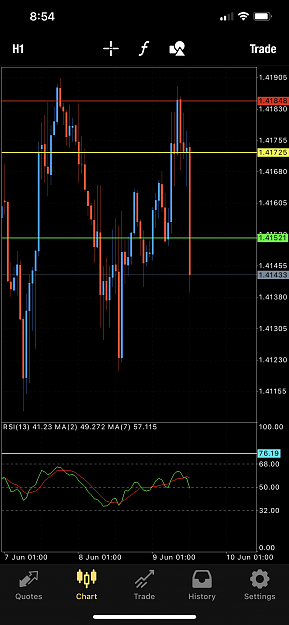
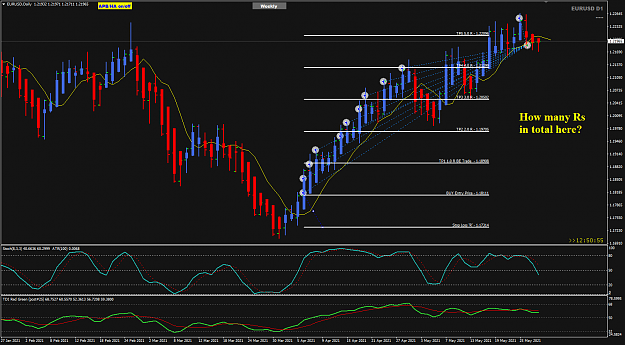
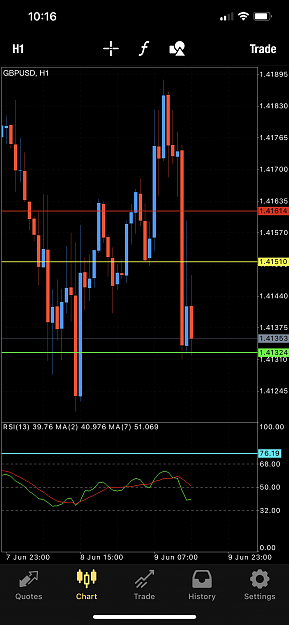
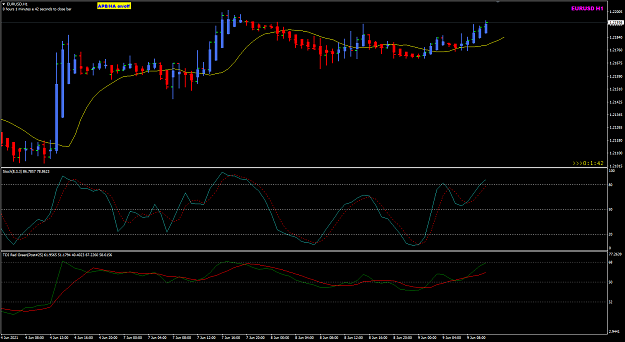
An example of a trading chart is this one below, I see more to the left of the current price action. I see the 5EMA yellow MA line.
I see the full Stochastoc (8,3,3,) and its levels 20,50 and 80.
I want to see the TDI levels - 32, 50 and 68.
Attached Image (click to enlarge)
Honesty is a very expensive gift. You wont find it in cheap people.WBuffett
2