Edit 24/6/21: Version 2.1 with MTF view https://www.forexfactory.com/thread/post/13598103#post13598103
Hi,
I'm sharing this tool for those who want to follow along Laura's new strat: https://www.forexfactory.com/thread/...ading-strategy
It's the "Daylight Trading Strategy", and there has already been some requests as to having a dashboard, so I've coded up this indicator.
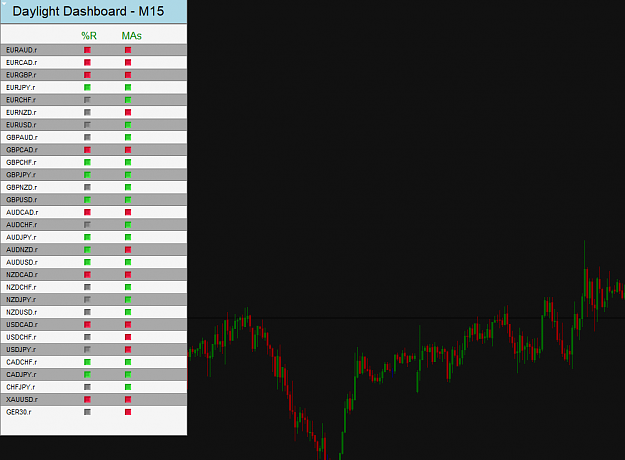
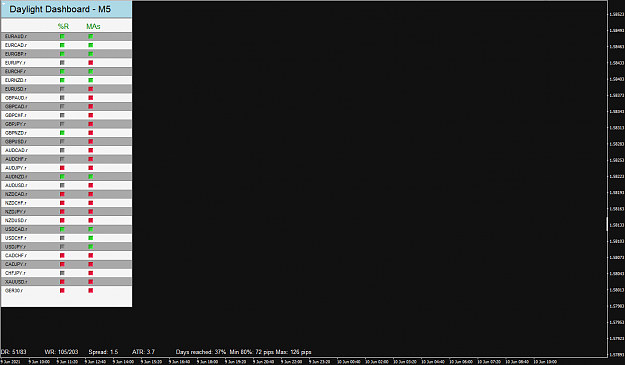
The aim is simply to help monitor when setups might occur, and alerting on certain conditions. The strategy is simple enough in itself, so there is no need to make things too complicated. Here is what it looks like:
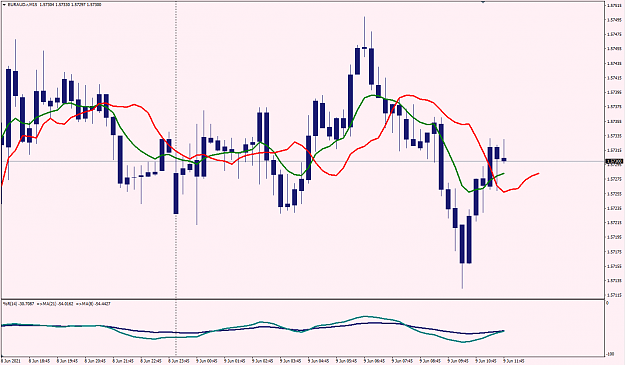
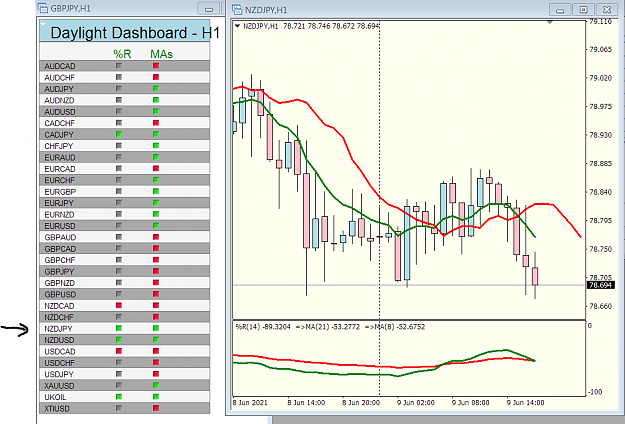
How you read it is simple: the "%R" column represents the sub-window. Green is bullish & daylight between the 2 MAs, red is bearish, and gray is no daylight. For example, on this chart the dashboard indicated "gray" at the time of the screenshot, because the 2 MAs in sub-window were too close together.
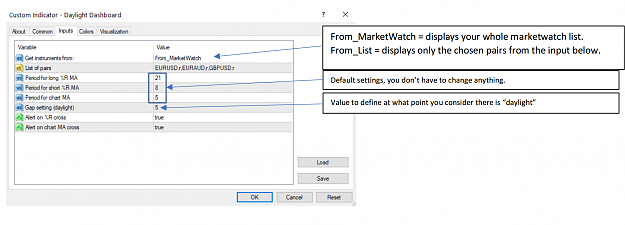
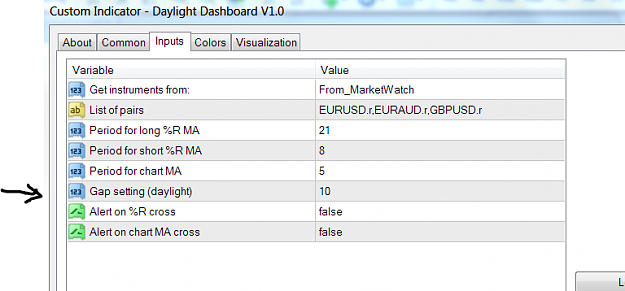
As for the settings, also nothing special:
The only item you should change is the first one, "Get instruments from". You can leave as is if you want to display your whole marketwatch, if not then you select the 2nd option, and you specify in "List of pairs" what instruments you want displayed.
The MA settings are the default.
And finally, there are 2 types of alert if you want, when the chart MAs cross, or when the %R MAs display enough daylight.
One important thing: You attach the indicator on a blank chart, on the timeframe you want monitored. On the original thread the recommended TF is M15, so you would attach it to a chart on that TF. If you want to monitor the M5 TF, well just switch to that.
Edit 24/6/21 : Version 2.1 with HTF view. https://www.forexfactory.com/thread/...3#post13598103
Edit 7/7/21 : Version 2.2 with modification on how the MarketWatch is accessed, and less freeze time
Have fun
Attached File(s)
