Anything above the line is an uptrend, below the line is a downtrend.
Dashboard - Gameboard - "Where is the fish" 72 replies
Broker Challenge "NDD/STP" vs. True "ECN" and "Mkt Mkr" broker talk 46 replies
Dealing with "Invalid Price", "Requote", "Server Busy" in MT4 3 replies
Is the Calendar showing USA off of Daylight Savings 0 replies
Disliked{quote} Does anyone else find their platform freezes when this is installed?Ignored
DislikedCould you code this indicator when both of the rules are met? Like Laura suggests. Currently we get a lot of alerts for main and sub window and there are too many alerts. We get a short entry signal when the following rules are met: 1. Red MA above Green MA on main chart and daylight exists between them. 2. Price closes below Green MA on main chart. 3. Red MA above Blue MA in sub-window and daylight exists between them.Ignored
DislikedHi Barraka, There is an issue with the dashboard always displaying one more pair than is selected in the Market Watch window. Are you sure it is looping for the correct number and checking for 'selected' pairs only? I always get one more at the end (next one in sequence alphabetically) to what I actually have selected in Market Watch. Also, would you mind making all the label objects 'hidden' from the object list please? It gets cluttered with too many items which the user would not need to select or modify. {I have downloaded the latest from post...Ignored

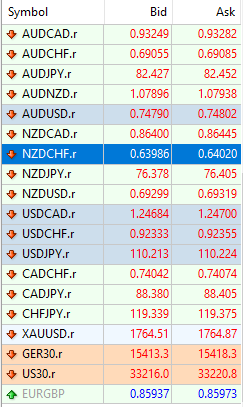
Disliked{quote} Hi Paul, I have also found this odd behavior as I was first testing it. You should find the culprits at the bottom of your Market Watch list: {image} For example here EURGBP, it's grayed out. So in that case you'd want to first remove the indicator, then delete that symbol (Select it, press Delete), and launch the Dashboard again. Let me know if this fixes the issue. Regards,Ignored
Disliked{quote} Hi, No, I've tried various things to eliminate it, including as you suggested above, but the spurious symbol is still listed. I use MT4 and do not see greyed out symbols in market watch, only those I've selected to be in there. Thanks,Paul.Ignored


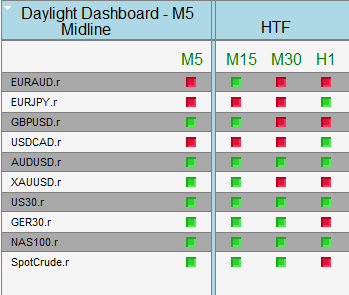
DislikedI've improved a few things on the dashboard, so releasing the version "2.1" of it (which you will find on the first post). The main addition is that you now have a mutli-timeframe view for each pair. The dashboard displays the next 3 higher timeframes to the chart it is attached on. Here is what it looks like: {image} On the right, the 3 columns show the MTF view, of the slow MA on the %R indicator. This is our overall htf bias. It corresponds to the red line: {image} So when the dashboard shows green, the red line is above -50. When it shows red,...Ignored
Disliked{quote} Thanks for your efforts Barraka. Sadly it has crashed on two different instances of MT4 with the following settings. {image} Default settings appear to work. Green Pips, Paul.Ignored
DislikedI am unsure of the last sell arrow on the attached chart - the lower chart shows the red line UNDER the black line - so it doesn't meet the requirement for a signal. why ? {image}Ignored
Disliked{quote} Hi Paul, Strange, if it works on the default and not on the one you posted... Can you have a look at the "Experts" tab, and after removing the indi you re-attach it with the settings that didn't seem to work. There may be some message there. Thanks,Ignored