• Home
  • Forums
  • Trades
  • News
  • Calendar
  • Market
  • Brokers
  • Login
  • Join
  • User/Email: Password:
  • 12:12am
Menu
  • Forums
  • Trades
  • News
  • Calendar
  • Market
  • Brokers
  • Login
  • Join
  • 12:12am
Sister Sites
  • Metals Mine
  • Energy EXCH
  • Crypto Craft

Options

Bookmark Thread

First Page First Unread Last Page Last Post

Print Thread

Similar Threads

Supply and Demand Thread using any Indicator 64 replies

Price Will Tell - Supply/Demand Price Action Trading 1,852 replies

C-12's Supply, Demand and PA thread 7,761 replies

Supply and demand indicator coding request 5 replies

  • Recycle Bin
  • /
  • Reply to Thread
  • Subscribe
  • 311
Attachments: (binned per thread starter’s request) Supply and Demand, Price
Exit Attachments

(binned per thread starter’s request) Supply and Demand, Price

  • Last Post
  •  
  • 1 16171819Page 20 21
  • 1 1819Page 20 21
  •  
  • Post #381
  • Quote
  • Feb 18, 2021 6:55pm Feb 18, 2021 6:55pm
  •  pampaq
  • | Joined May 2013 | Status: Member | 867 Posts
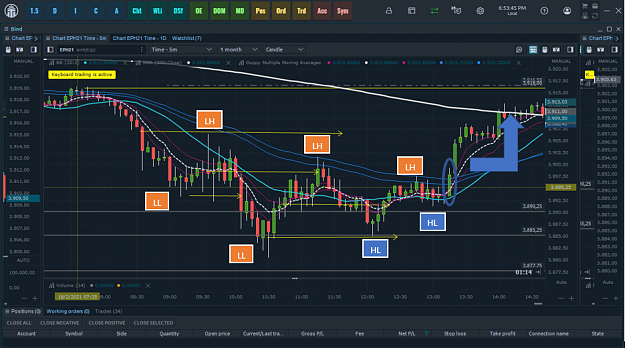
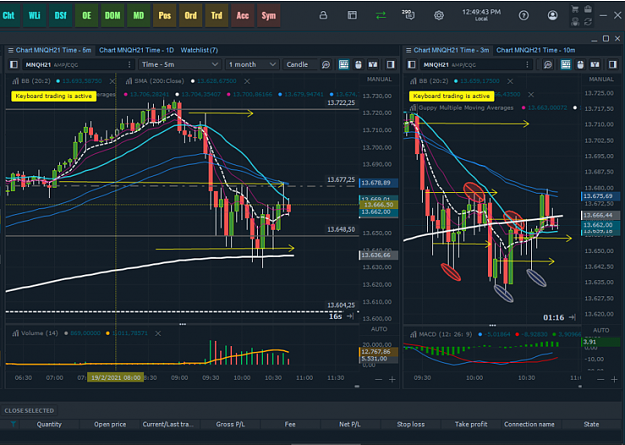
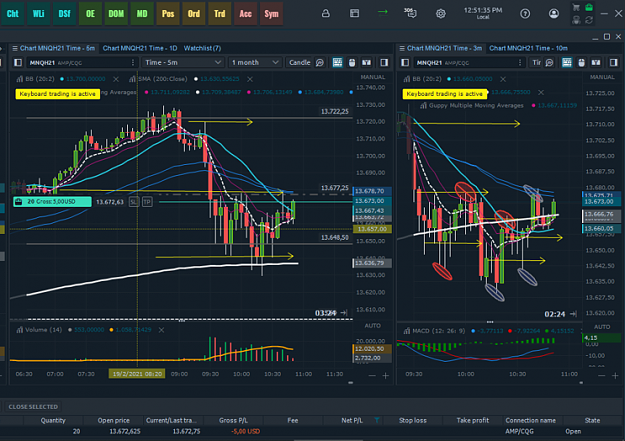
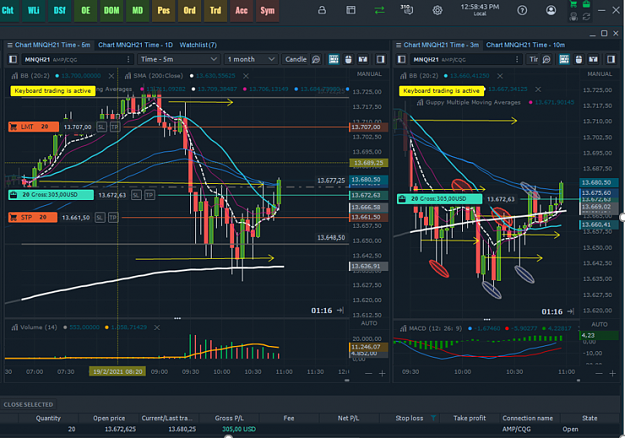
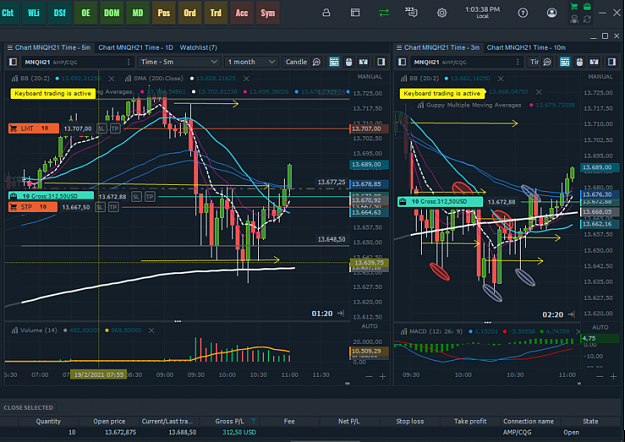
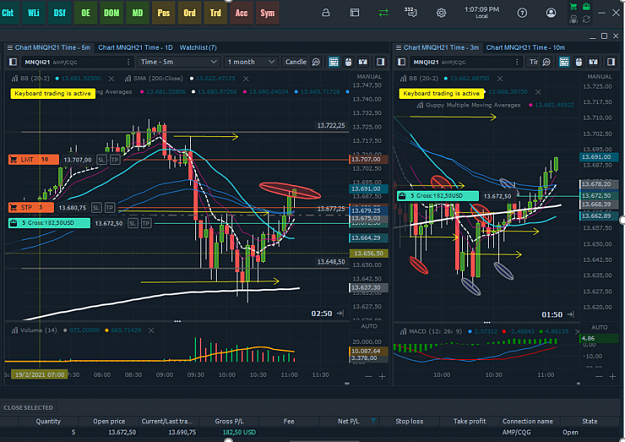
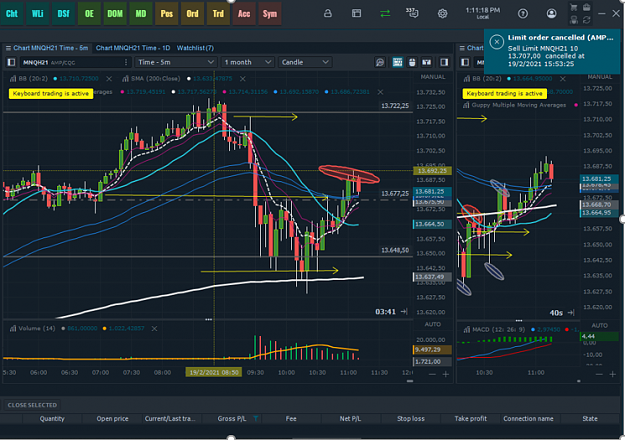
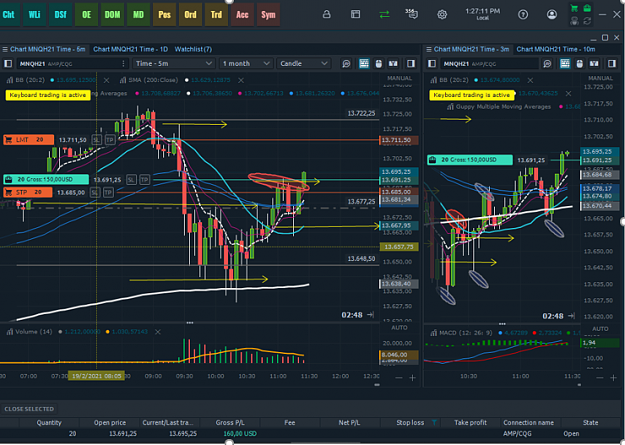
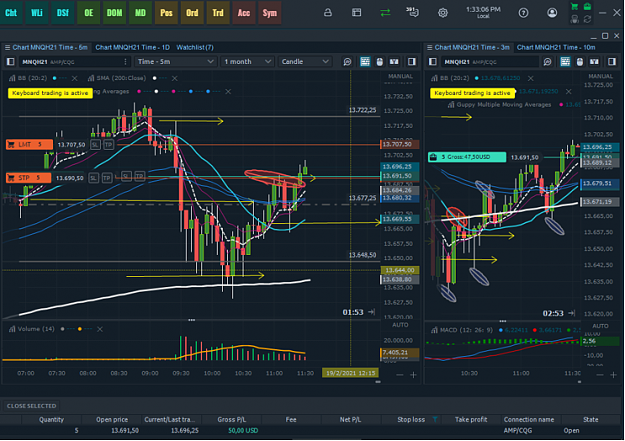
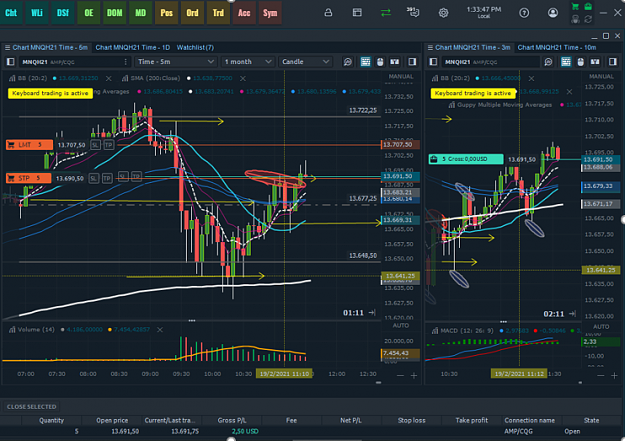
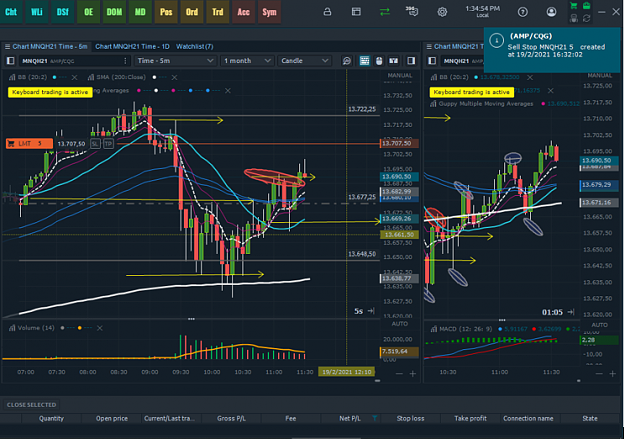
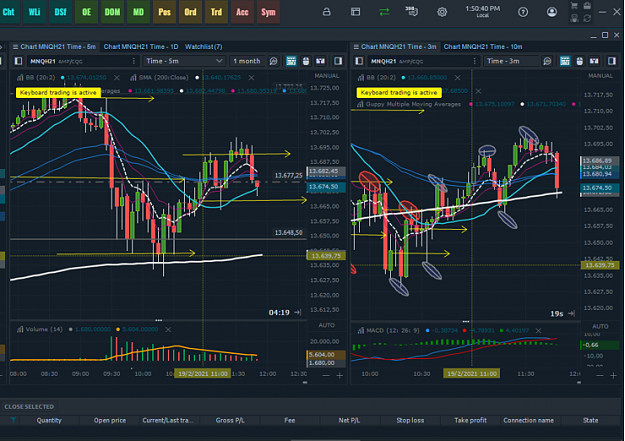
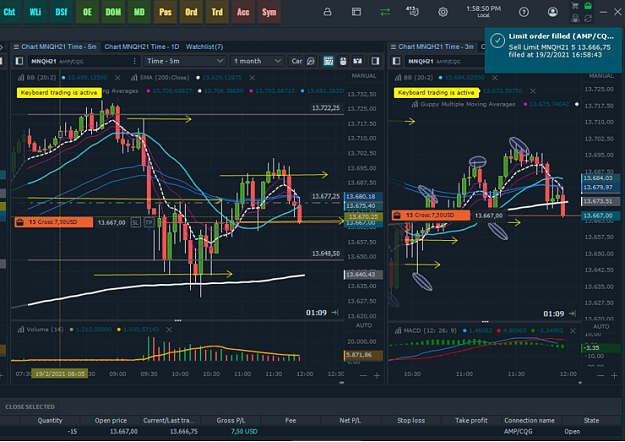
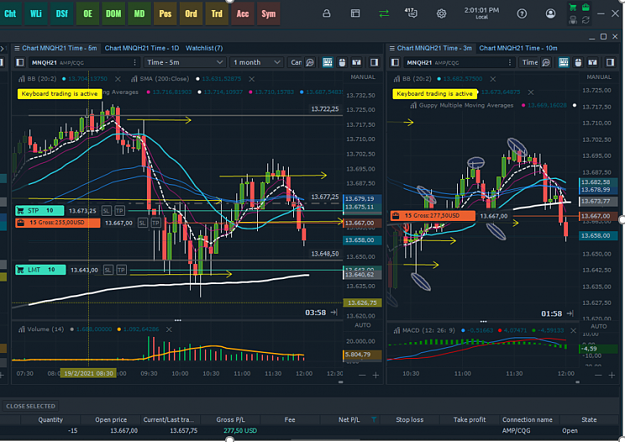
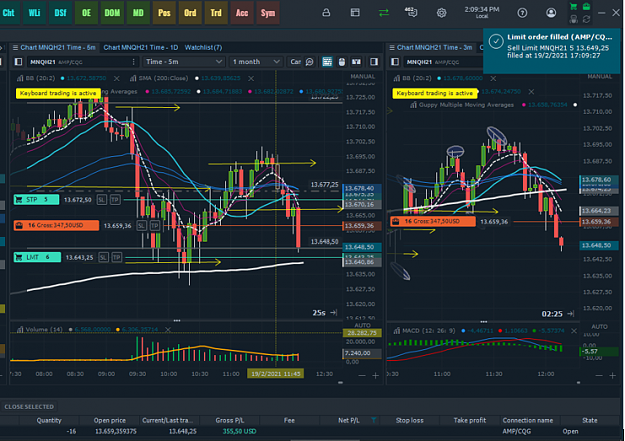
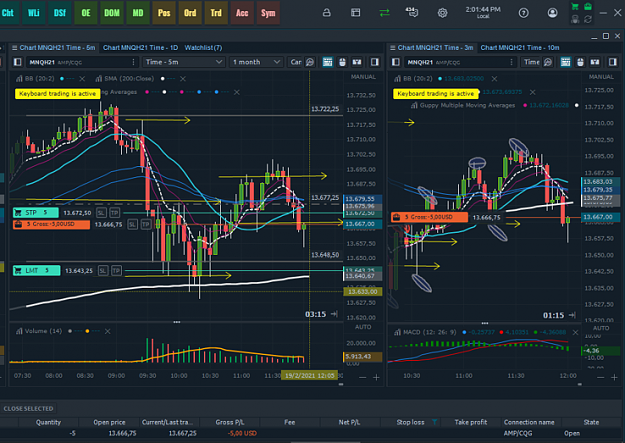
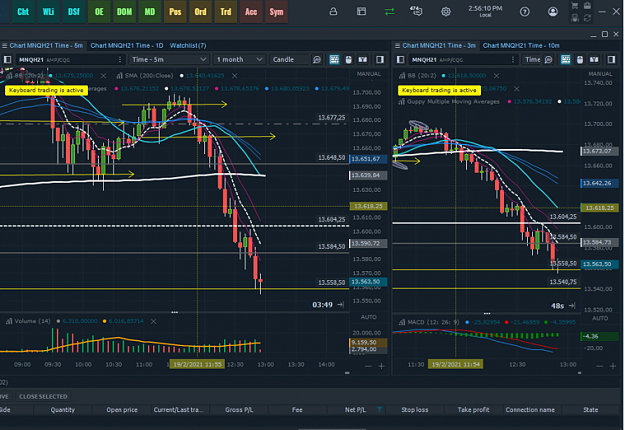
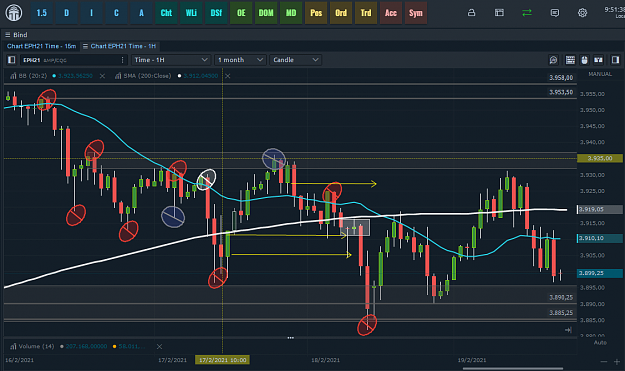
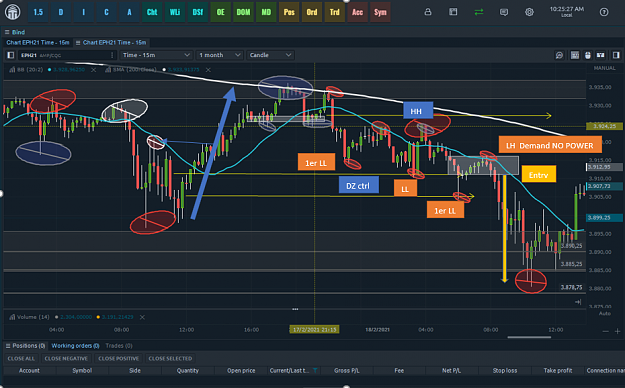
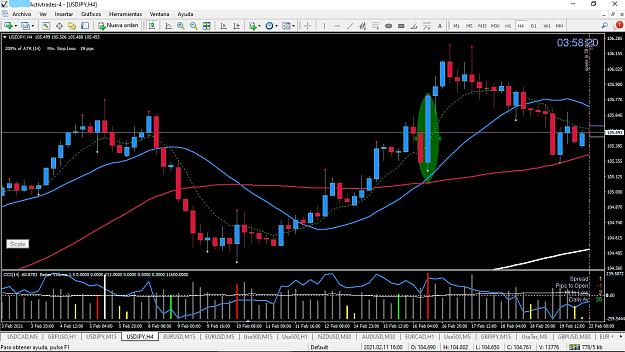
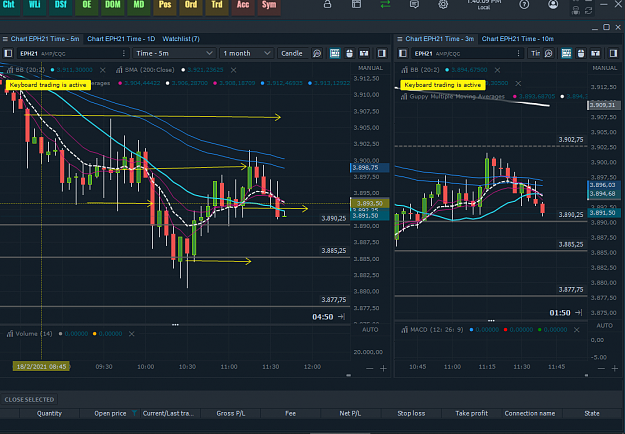
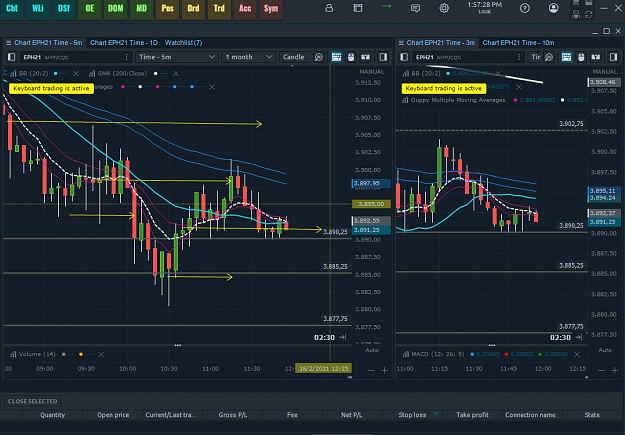
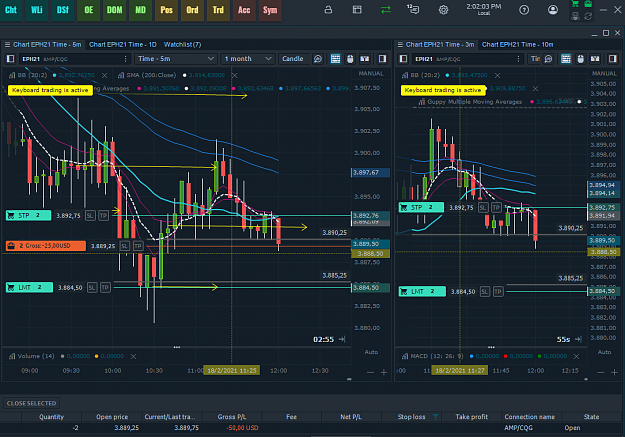
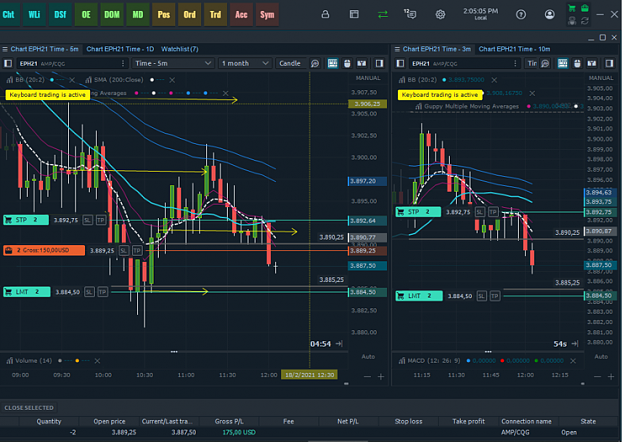
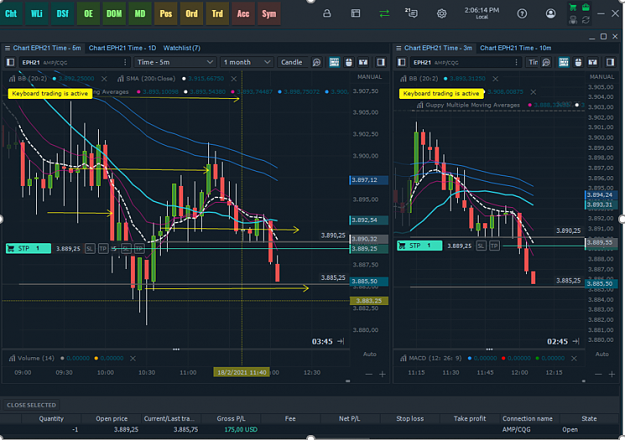
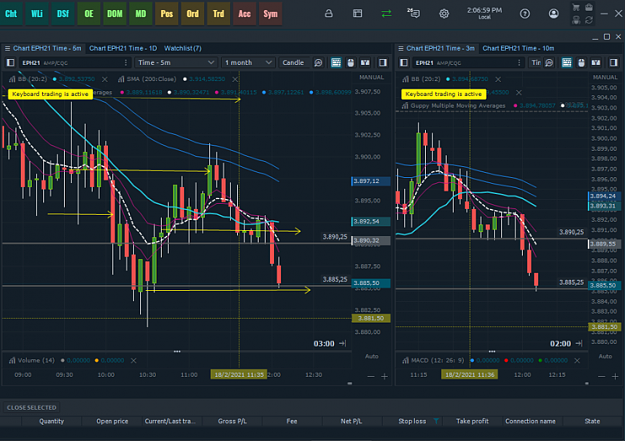
ANOTHER 3rd ENTRY. We see that there was a big bullish pullback, we measure the strength and weakness of each, and we re-identify the probable dz and sz. In yellow arrows. Stand by. Continue stand by fig (2). Entry Fig (3). Trade control Fig (4) TP Fig (5). Partial close and TP in DZ. End of day Fig6.
Attached Images (click to enlarge)
Click to Enlarge

Name: Tercera entrada fig 1 stand by (2).png
Size: 104 KB Click to Enlarge

Name: Tercera entrada Continuacion SB (2).png
Size: 103 KB Click to Enlarge

Name: Tercrera entrada Fig (3) Entry.png
Size: 118 KB Click to Enlarge

Name: tercera entrada ctrl entry.PNG
Size: 211 KB
Click to Enlarge

Name: terceraentrada TP.PNG
Size: 210 KB Click to Enlarge

Name: tercera entrada tp dos final.PNG
Size: 203 KB
3
 
  • Post #382
  • Quote
  • Feb 18, 2021 6:57pm Feb 18, 2021 6:57pm
  •  pampaq
  • | Joined May 2013 | Status: Member | 867 Posts
Evaluation of the SZ and DZ of today, On the rise, I was not present, it is the same method over and over again, on occasions like the latter the price runs fast, and in this case it can be seen in the graph about 13 pts That with two lots is 1300 USD. In the E-Mini, in the Micro about 130 USD.
Attached Image (click to enlarge)
Click to Enlarge

Name: Evaluacion final y mejor oportunidad notomada.png
Size: 243 KB
2
 
  • Post #383
  • Quote
  • Feb 19, 2021 4:29pm Feb 19, 2021 4:29pm
  •  pampaq
  • | Joined May 2013 | Status: Member | 867 Posts
As we finished yesterday, we are entering the market hoping to be on the right side of it, for when the Big Boys come in, we have a chance to see a great run. To do this we evaluate and compare the strength and weaknesses of the impulses and their setbacks, identifying the areas of demand and the areas of supply.
Today I have made several trades, I show one to give an example of how it is possible to look at these SZ and DZ, in turn taking into account the cancellation of those areas by the other.
Example 1:
Fig. 1 Stand By identifying the SZ and DZ. Fig 2, the demand cancels the offer and leaves us an entry opportunity, there is a void of rising prices, although the Sma are falling and that is a downward force. We are in the future of the Nasdaq 100, MICRO E-Mini. 4 ticks = 1pto = 2 USD. Fig. 3, ctrl entry, we are in the downtrend of the upper TF of 15M and the sma 20 going down, for which we are vigilant. Fig. 4, we take part of the profits and adjust sl. Fig. 5,
Si a + and another lot reduction, due to the presence of an offer at that level. Fig. 6, SL. So far the bullish mmtum. It did not arrive at the previous HH, so we detected an offer there.
Attached Images (click to enlarge)
Click to Enlarge

Name: grafico 1 ST B.PNG
Size: 228 KB Click to Enlarge

Name: Fig2 entry.PNG
Size: 236 KB Click to Enlarge

Name: Fig.3 ctrl entry.PNG
Size: 244 KB Click to Enlarge

Name: Fig.4 Toma ganancias.PNG
Size: 249 KB
Click to Enlarge

Name: Fig5 Nueva toma ganancias.PNG
Size: 246 KB Click to Enlarge

Name: Fig. 6 SL.PNG
Size: 227 KB
 
 
  • Post #384
  • Quote
  • Feb 19, 2021 4:30pm Feb 19, 2021 4:30pm
  •  pampaq
  • | Joined May 2013 | Status: Member | 867 Posts
Another Trade, Fig. A1, entered the market, somewhat late. Fig. A2, without mmtum we removed a large part and BE. Fig. 3, SL. Again begin to analyze the zones.
Attached Images (click to enlarge)
Click to Enlarge

Name: Fig. A1entry tarde.PNG
Size: 246 KB Click to Enlarge

Name: Fig A2,BE.PNG
Size: 238 KB Click to Enlarge

Name: Fig A3 SL.PNG
Size: 240 KB Click to Enlarge

Name: Fig A4 SL.PNG
Size: 226 KB
 
 
  • Post #385
  • Quote
  • Feb 19, 2021 4:33pm Feb 19, 2021 4:33pm
  •  pampaq
  • | Joined May 2013 | Status: Member | 867 Posts
Another trade, we have verified, that at these price levels there is no demand, so our expectations change and we will see to control, and identify, the new defined areas. It is here where many times, due to the anxiety of being in the market, we make mistakes, the best way to avoid wrong income is to follow the flow of the areas that the price traces us. Until it becomes evident, of itself, that one area cancels the other and there we give it enter. Fig B1, Stand By. Fig. B2, Entry due to demand cancellation. Fig B3, ctrl trade. Fig. B4, take profit and place SL. For lack of bearish continuation. Fig. B5, batch aggregation, by bearish mmtum, and profit taking schedule by flat 200 sma, (which is the 20 sma of 1H). Fig. B6, bearish continuation to SM 15m and 1H. There in this last movement, we realize that we are next to the Big Boys, because the price is going down with great mmtum, and speed, we left by making 100 points exactly. The work of monitoring the zones until one cancels the other, gives us the probability that at some point we will be on the side of the big hands and thus have one of those days that are worth a week. Greetings.
The order of Fig. 4 and 5 are reversed.
Attached Images (click to enlarge)
Click to Enlarge

Name: Fig B1 SB.PNG
Size: 237 KB Click to Enlarge

Name: Fig B2 Entry.PNG
Size: 242 KB Click to Enlarge

Name: Fig B3 ctrl trade.PNG
Size: 245 KB Click to Enlarge

Name: Fig B5 agregacion.PNG
Size: 250 KB
Click to Enlarge

Name: Fig B4 ajuste sl.PNG
Size: 241 KB Click to Enlarge

Name: Fig B6 TP.PNG
Size: 226 KB
 
 
  • Post #386
  • Quote
  • Feb 20, 2021 7:54am Feb 20, 2021 7:54am
  •  pampaq
  • | Joined May 2013 | Status: Member | 867 Posts
An example to understand the balance of power between supply and demand, in my conception. We are in the TF 1H, we see on the left a succession of LL LH LL LH, which defines a downtrend in this TF. In turn, many traders use instead of this definition, the inclination of a trend line, in this example sma 20. or downtrend. We have a MS and a sma 200 below.
And there something happens that should draw our attention in the pre-market analysis. It rises strongly, from the LL at the major support, until it leaves an HH at full major resistance. What is this for, good to identify strong areas of demand and supply, and have them well marked. We now have a TA, and this point is important, that of the definition of trends, which personally is when the last reference pivot is broken, in this case I mark it blank, when the pivot is broken the Momentum is bullish , but now we have the presence of another pivot that defines another MR.
We can think that it can break upwards, and for this we read the candles. Engulfing -, engulfin + and then another big negative engulfing. Up there in that sector there is a lot of offer. The price falls, how far? until the start of the bullish momentum, marked with yellow arrows. What should we see there? Well, if the last impulse has been bullish, there we should see demand. The demand appears but leaves us a great engulfing +, without continuity. NFT. Where that large bullish envelope slows down, in the marked supply zone, there it goes down, the demand reacts, but now we see that it is weak, a hammer -, a doji and then the offer appears aggressively and takes the price to a new LL. He drops 28 points, which is a huge thing. And there we can enter that marked rectangle, when the demand is canceled, canceled, and we see the presence again of the offer. That would be one of the many ways of reading the market. This method provides a great probability of success, and security, which brings us added tranquility to manage the trade, away from fear and greed, which are the psychological oppressions that make us make wrong decisions, due to being under pressure and distorting the reality of our appreciations.
Attached Image (click to enlarge)
Click to Enlarge

Name: Ejemplo de cancelación 18 02.PNG
Size: 67 KB
 
 
  • Post #387
  • Quote
  • Feb 20, 2021 8:36am Feb 20, 2021 8:36am
  •  pampaq
  • | Joined May 2013 | Status: Member | 867 Posts
Same graphic, now TF15M. Small ellipses are the pivots of TF 15M. Bullish trend, collides with the 200, for the rise and there is confluence, it is the Major Resistance 1H, and confluence with the 200 15M. We see how it leaves candles type dojis, indecision and lack of power, then negative engulfing, and tries the demand to retest the HH, it does not succeed and leaves the first LH, it gives us an LL, close to the demand zone, but not this still in it. It rises and to the height where the last bullish reference pivot of 15m was broken (blue ellipse and white rectangle) it falls again, now if until the marked demand zone, it bounces strongly, and tells us that if it had entered sold in the first LH we would be at a loss. What we are looking to see is that the market is weak, and that is seen in the strength of supply, and in the weakness of demand, that reaction tells us that the demand, the buyers are still there, I must see first to enter into Peace, may the buyers run out there. and that is self-evident, in the white rectangle. And in turn now we have an LL and an LH without power, without demand at that price. Ready to run to the downside, we see that it lags on the start of major support (MS) but then exhausts its decline. Greetings
Attached Image (click to enlarge)
Click to Enlarge

Name: EJEMPLO CANCELACIÓN TF15M 1802.PNG
Size: 198 KB
 
 
  • Post #388
  • Quote
  • Feb 21, 2021 9:42am Feb 21, 2021 9:42am
  •  T4Trade
  • Joined Sep 2017 | Status: Trend Following,Price Action,Grid | 1,951 Posts
another idea to share with you guys.
Attached Image (click to enlarge)
Click to Enlarge

Name: 47769009e045af5f08798bb2ac823312.png
Size: 185 KB
 
 
  • Post #389
  • Quote
  • Feb 21, 2021 6:08pm Feb 21, 2021 6:08pm
  •  pampaq
  • | Joined May 2013 | Status: Member | 867 Posts
Attached Image (click to enlarge)
Click to Enlarge

Name: WRB 2102_LI.jpg
Size: 1.0 MB
 
 
  • Post #390
  • Quote
  • Feb 22, 2021 4:07pm Feb 22, 2021 4:07pm
  •  Sossos
  • Joined Apr 2013 | Status: Member | 683 Posts
Hey Winston, who the hell is this guy? His stuff is nothing like what you're showing people. MA's and CCI's are you kidding me?
 
 
  • Post #391
  • Quote
  • Feb 22, 2021 5:44pm Feb 22, 2021 5:44pm
  •  Winston Reed
  • Joined Mar 2009 | Status: Hobby Trader | 5,785 Posts
My posts here on FF will be extremely limited. Please go to the-gapbar-trader.com (www.the-gapbar-trader.com/)
Hobby Trader
 
 
  • Post #392
  • Quote
  • Feb 22, 2021 9:31pm Feb 22, 2021 9:31pm
  •  Sossos
  • Joined Apr 2013 | Status: Member | 683 Posts
Thanks
 
 
  • Post #393
  • Quote
  • Feb 23, 2021 10:01am Feb 23, 2021 10:01am
  •  bartlby37
  • | Joined Nov 2015 | Status: Member | 199 Posts
USDCAD - didin't take the long but thinking about short at marked area
Attached Image (click to enlarge)
Click to Enlarge

Name: 833a62ebda4741ebeea5d151edd84948.png
Size: 75 KB
 
 
  • Post #394
  • Quote
  • Feb 23, 2021 10:13am Feb 23, 2021 10:13am
  •  bartlby37
  • | Joined Nov 2015 | Status: Member | 199 Posts
Aussie - Didn't quite come back as far as I'd hoped
Attached Image (click to enlarge)
Click to Enlarge

Name: 13556bc38a2e357e9a66b10228f5ba0e.png
Size: 70 KB
 
 
  • Post #395
  • Quote
  • Feb 23, 2021 10:14am Feb 23, 2021 10:14am
  •  bartlby37
  • | Joined Nov 2015 | Status: Member | 199 Posts
Sorry - that a JPY chart above
 
 
  • Post #396
  • Quote
  • Feb 23, 2021 10:18am Feb 23, 2021 10:18am
  •  bartlby37
  • | Joined Nov 2015 | Status: Member | 199 Posts
Cable 5minute chart - I'd like a much deeper pullback and that looked possible but news turned things round - see what's next
Attached Image (click to enlarge)
Click to Enlarge

Name: bbdf3bc97ddf47c356d9d2436eb03f6e.png
Size: 64 KB
 
 
  • Post #397
  • Quote
  • Feb 23, 2021 10:22am Feb 23, 2021 10:22am
  •  bartlby37
  • | Joined Nov 2015 | Status: Member | 199 Posts
And this is my Aussie chart - possible deeper pullback - although no real structure on the left but doubling previous pullbacks
Attached Image (click to enlarge)
Click to Enlarge

Name: 3c242a9ff0307c4346071ebef5dd72bf.png
Size: 63 KB
 
 
  • Post #398
  • Quote
  • Feb 23, 2021 5:49pm Feb 23, 2021 5:49pm
  •  utuber
  • | Joined Oct 2014 | Status: Member | 16 Posts
Quoting Winston Reed
Disliked
My posts here on FF will be extremely limited. Please go to the-gapbar-trader.com (www.the-gapbar-trader.com/)
Ignored
This website Winston....
Unfortunately it would seem your getting crowded out here
Attached Image (click to enlarge)
Click to Enlarge

Name: the-gapbar-trader.jpg
Size: 66 KB
 
 
  • Post #399
  • Quote
  • Feb 24, 2021 9:31am Feb 24, 2021 9:31am
  •  bartlby37
  • | Joined Nov 2015 | Status: Member | 199 Posts
Cable 5min - No idea what price does from here but the chart is sort of pretty
Attached Image (click to enlarge)
Click to Enlarge

Name: f3f5d1c572182f3b1191479dd1a4f8ea.png
Size: 64 KB
 
 
  • Post #400
  • Quote
  • Feb 24, 2021 9:43am Feb 24, 2021 9:43am
  •  pakeha
  • | Joined Sep 2011 | Status: Member | 409 Posts
Quoting bartlby37
Disliked
Cable 5min - No idea what price does from here but the chart is sort of pretty {image}
Ignored
Powell testifies again in 20 min, so may see some movement then.
 
 
  • Recycle Bin
  • /
  • (binned per thread starter’s request) Supply and Demand, Price
  • Reply to Thread
    • 1 16171819Page 20 21
    • 1 1819Page 20 21
0 traders viewing now
  • More
Top of Page
Forex Factory Blog Updated: Alerting All Members
  • Facebook
  • Twitter
About FF
  • Mission
  • Products
  • User Guide
  • Media Kit
  • Blog
  • Contact
FF Products
  • Forums
  • Trades
  • Calendar
  • News
  • Market
  • Brokers
  • Trade Explorer
FF Website
  • Homepage
  • Search
  • Members
  • Report a Bug
Follow FF
  • Facebook
  • Twitter

FF Sister Sites:

  • Metals Mine
  • Energy EXCH
  • Crypto Craft

Forex Factory® is a brand of Fair Economy, Inc.

Terms of Service / ©2022