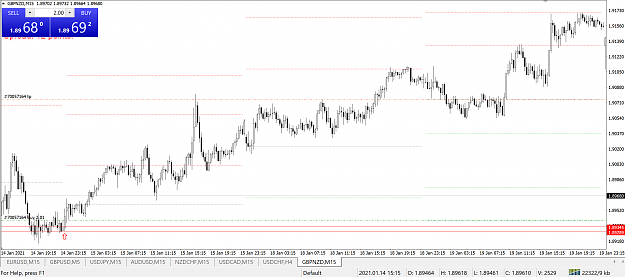
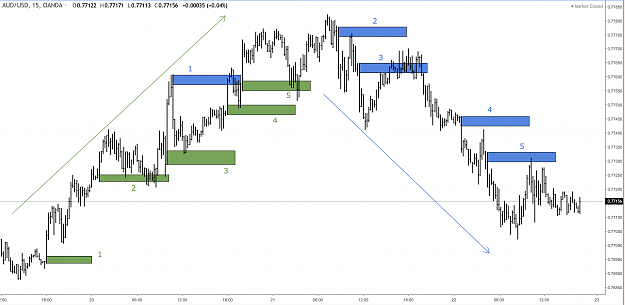
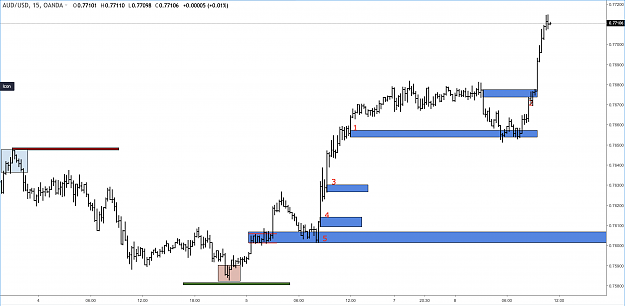
This is the overall context within which you are long.
Attached Image (click to enlarge)

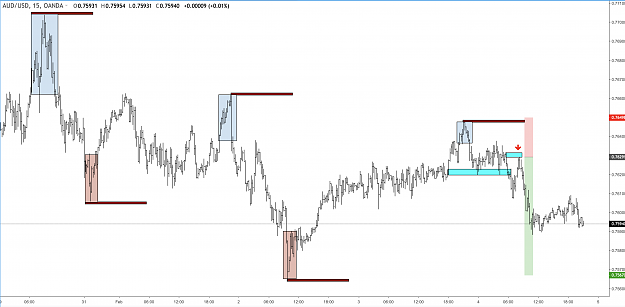
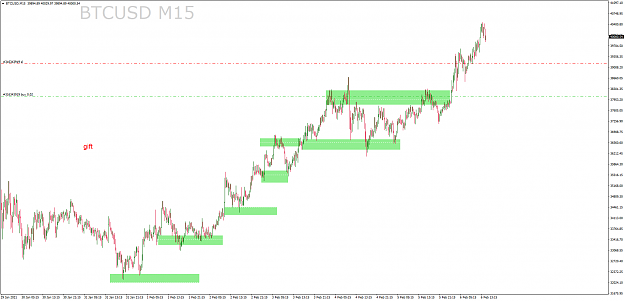
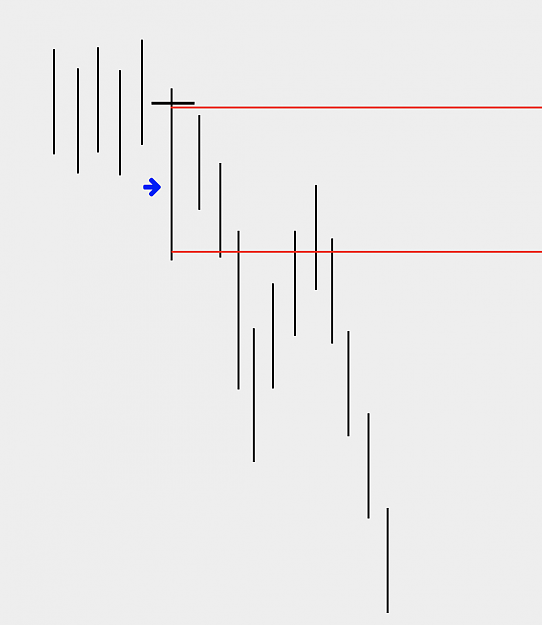
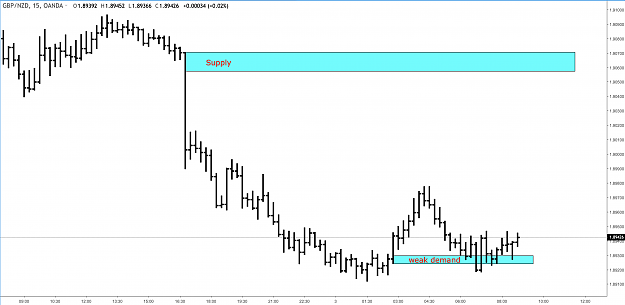
It is certainly possible that price may want to rise to fill the gap above.
However any existing demand that might push price up seems quite weak.
Personally I would want to see stronger demand for price to test and bounce up towards the gap.
It could definitely grind its way up but I would not consider it a high probability trade.
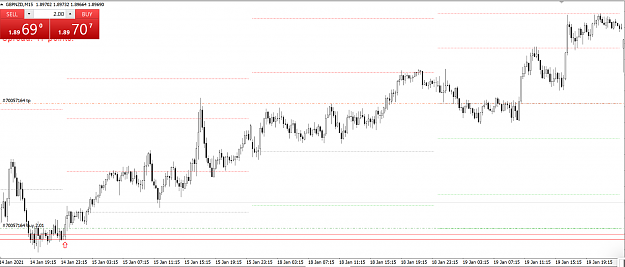
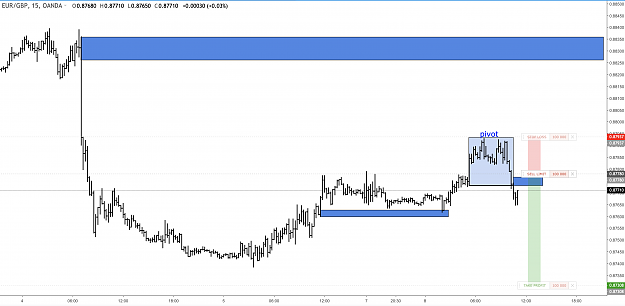
Attached Image (click to enlarge)
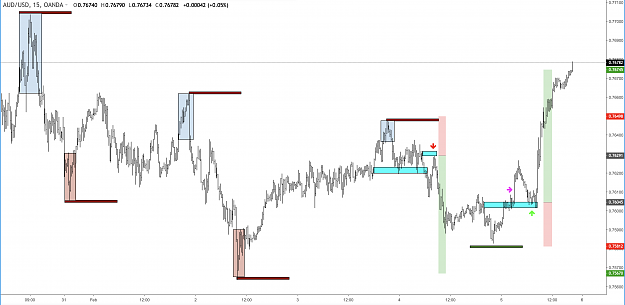
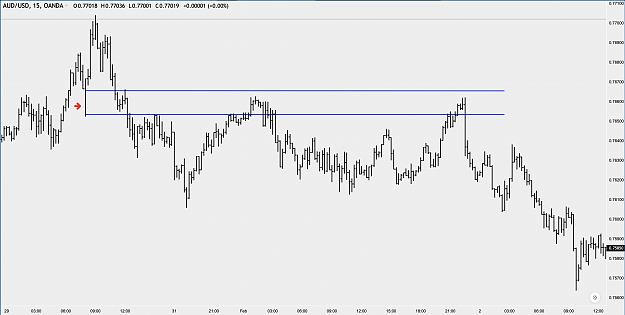
Finally let me suggest you reconfigure your chart so that the price action is not so small. Price action should be the most important item on your chart.
3