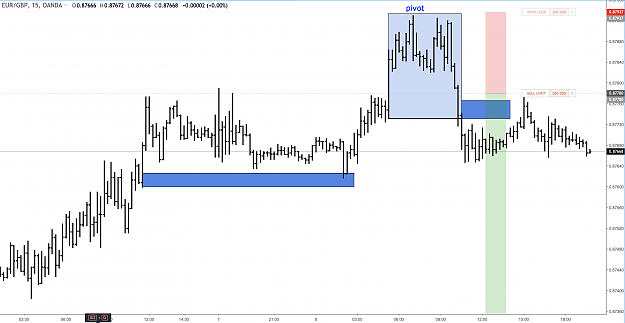
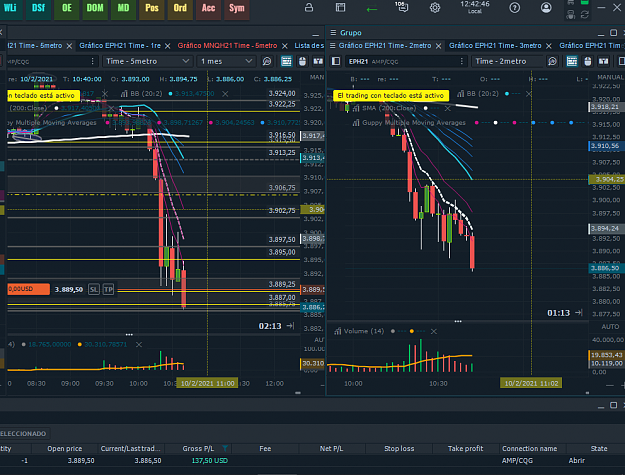
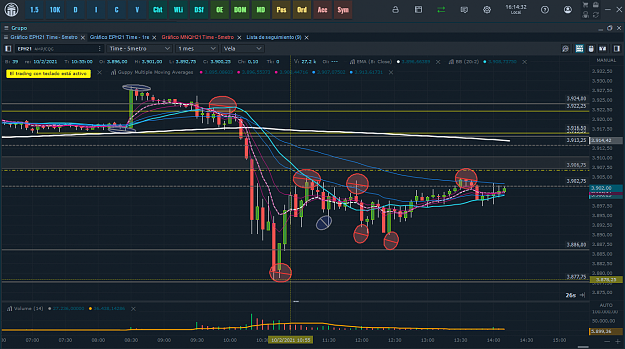
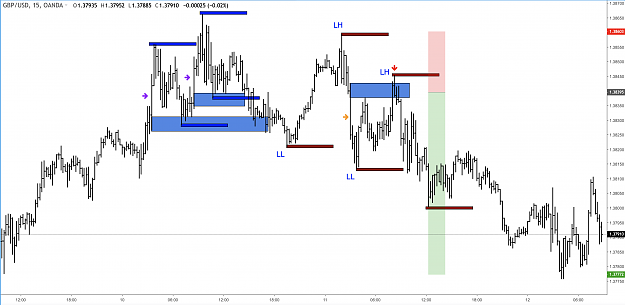
A difficult day, to operate with a certain probability of success, and peace of mind. It starts upwards, leaves a deep setback, and there we notice that LL is doing. Then HH, HL, and leaves a failed retest of HH. We now have an LH and do an LL. Expectation, that goes down, doing another LL. It breaks down and leaves us about 5 Pts of TP.
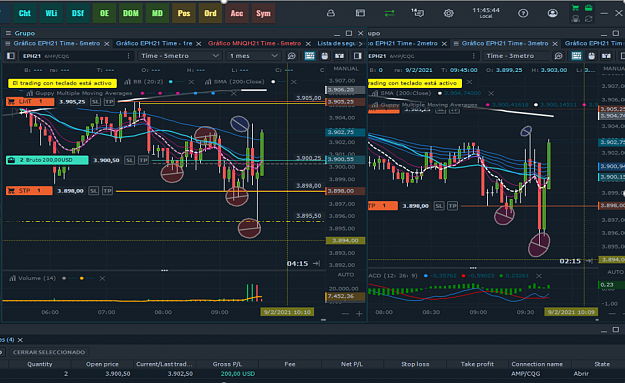
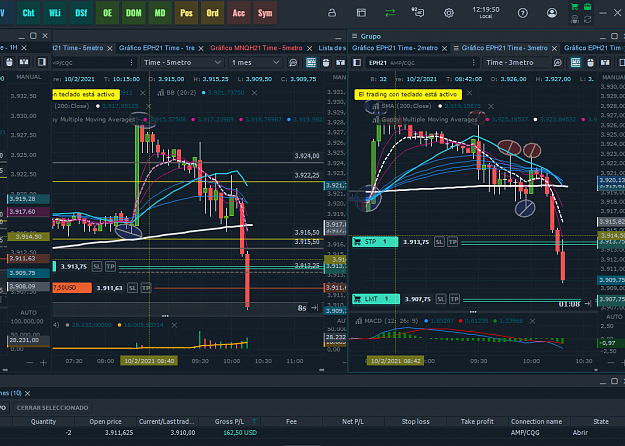
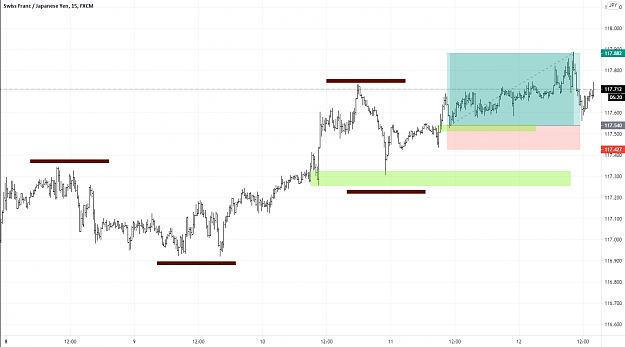
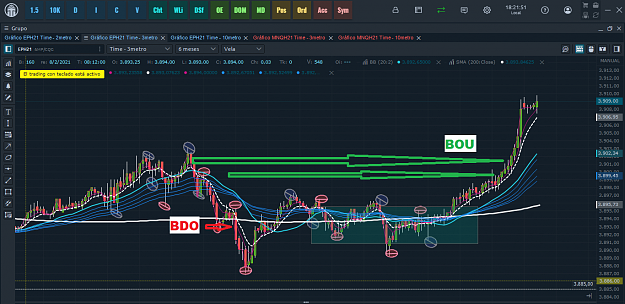
Strong upward movement, and then a series of HH and LL at a similar height. That is a range. Then the bullish breakout, which accelerates as it reaches the supply zone. Break that MRI with a decision candelstick. And there again with a high probability of success and tranquility we can take another 6 points, which the market gives us.
Patience, and decision, at the right time. Greetings.
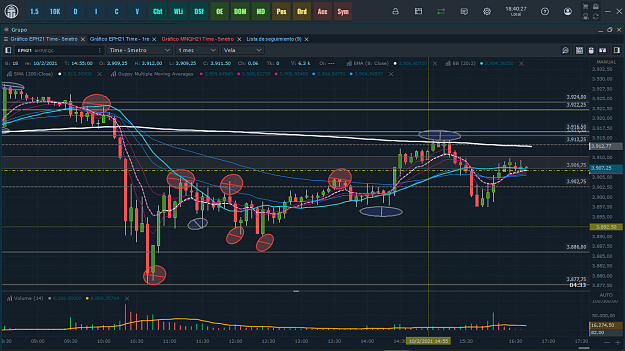
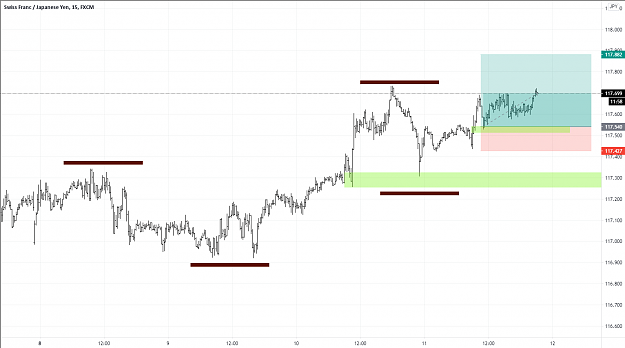
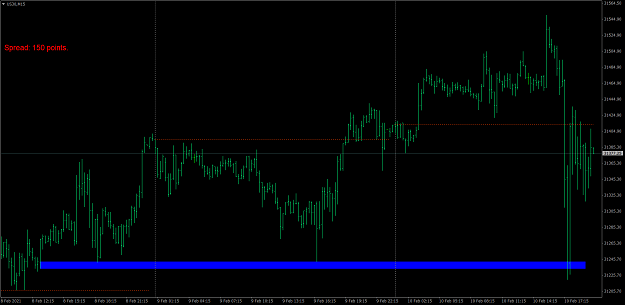
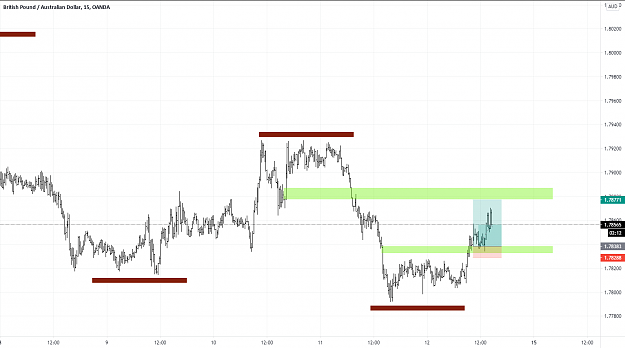
Attached Image (click to enlarge)
1