Disliked{quote} If you say 2100, you mean price ? May I ask you to post the same graphs with dates <( I presume?) , at the bottom axis? I want to see if theres any correlation between your graphs and the forces I trade , on long TFs? ( thought is here your COT strategy, and a precision entry on my forces...i can pinpoint Reversals SPOT ON, but waay to much a newbie to act on them...lol)Ignored
Usually when there is a gap, it tends to close it (after a long or short time, it doesn't matter) then it goes back to it weekly open
What it did back then, it opened down to 2085, closed its gap 2102, but didn't reach back its weekly open 2085.
So i guess we should reach it back. I may be totally wrong though, so we'll see
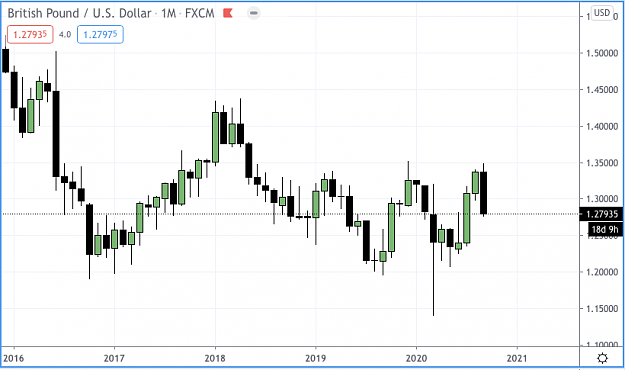
Here are the same charts with date
Attached Image

Attached Image

COT: The precious data ignored