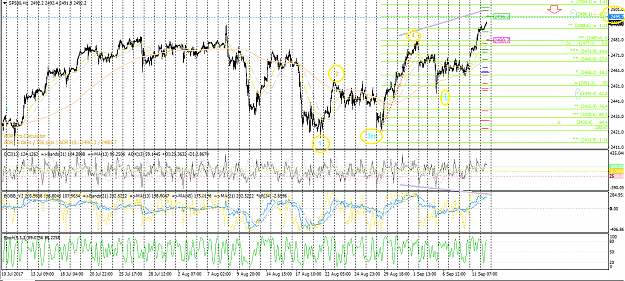
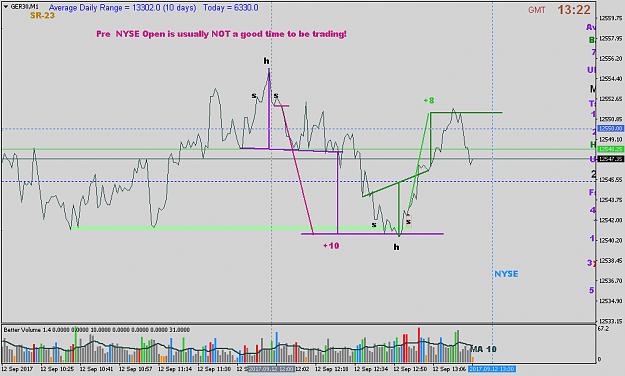
Short here at 542.8... looks like bearish divergence. let's see. SL at BE
 Dax - Daily analysis and Discussion
- #381
- Edited 5:01am Sep 12, 2017 4:49am | Edited 5:01am
- | Joined Jan 2015 | Status: Zaedno pravi sila. Cosmos e za nas. | 1,932 Posts
- #382
- Sep 12, 2017 5:02am Sep 12, 2017 5:02am
- | Joined Jan 2015 | Status: Zaedno pravi sila. Cosmos e za nas. | 1,932 Posts
- #383
- Sep 12, 2017 5:34am Sep 12, 2017 5:34am
- Joined Jul 2016 | Status: Trader | 3,318 Posts
trading is simple but is simple is not easy.
- #385
- Sep 12, 2017 5:50am Sep 12, 2017 5:50am
- Joined Jul 2016 | Status: Trader | 3,318 Posts
trading is simple but is simple is not easy.
- #386
- Edited 6:43am Sep 12, 2017 6:20am | Edited 6:43am
- Joined Jan 2007 | Status: Trader | 11,838 Posts
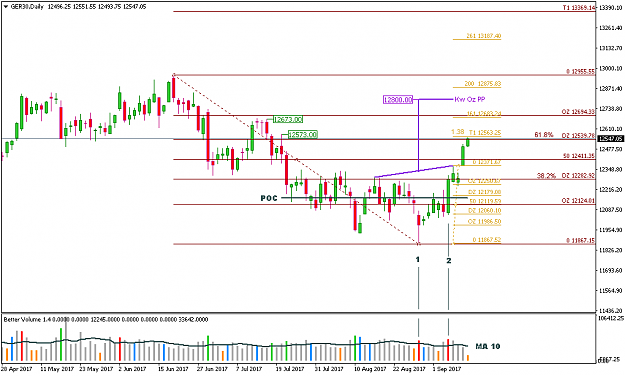
Trading Levels with WRBs
- #388
- Sep 12, 2017 7:02am Sep 12, 2017 7:02am
- Joined Jan 2007 | Status: Trader | 11,838 Posts

Trading Levels with WRBs
- #389
- Edited 7:42am Sep 12, 2017 7:15am | Edited 7:42am
- Joined Jul 2016 | Status: Trader | 1,453 Posts
... panta rei ... (Heraclitus of Ephesus, 535-475 BC)
- #394
- Sep 12, 2017 7:46am Sep 12, 2017 7:46am
- Joined Jul 2016 | Status: Trader | 3,318 Posts
trading is simple but is simple is not easy.
- #397
- Sep 12, 2017 8:23am Sep 12, 2017 8:23am
- Joined Jan 2007 | Status: Trader | 11,838 Posts
Trading Levels with WRBs