I decided to open this journal only for the purposes of my own motivation, discipline and psyche control. I hope it will help me stick to my strategy and level up my equity curve.
I will be posting MT4 screen shots each evening with my trades, notes as to why I traded and any ideas/suggestions for future.
Below assumptions and methodology, I will be updating this as I go along.
1. Instruments
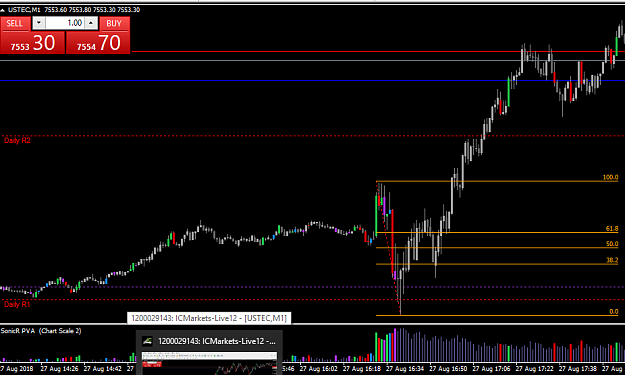
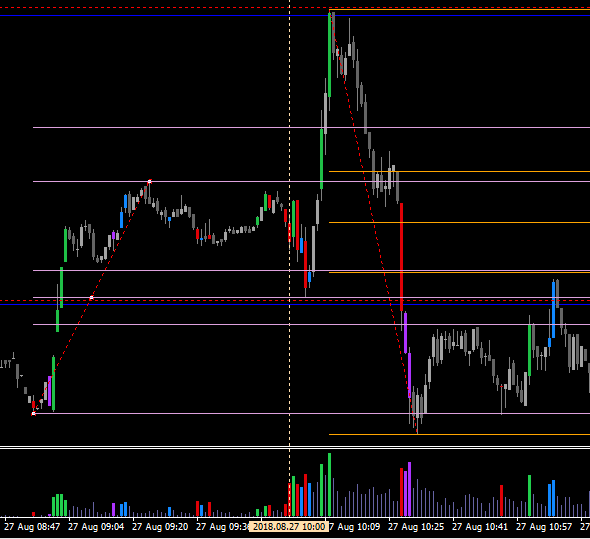
I trade only Dax and Nasdaq CFDs at the cash open which is 9:00 am CET and 15:30 CET respectively.
I trade M1 timeframe.
I trade max 1h after the cash market open.
Spread for both is 1 point in the above timeframe.
I might not be able to trade Nasdaq every single day due to other commitments, but I should be able to trade Dax daily.
2. Strategy/methodology
I use only:
- Significant Suppport/Resistance (S/R) on the M15 for the last 3 days
- Fibo retracement levels for the first swing after cash market opens plus any further when significant move occured
- Round figures i.e. full hundreds (higher priority) and 50s e.g. 12100 and 12150 for Dax and 7400 and 7450 for Nasdaq
- High Value Area (usually 1 min of trading) as significant S/R
- Pivot Points and Support and Resistance from PP
I will be trading Price Action around these significant number/levels, so I might trade bounces off these levels or break out of them.
Sometimes I might also trade in the consolidation.
3. Money Management
SL is 10 points. I will move SL to Break Even once the price moves in the direction of a trade for 3 points.
TP is 15 points. Obviously it will depend on the price action and what I see when candles are being drawn.
If the movements is significant (which often happens on Nasdaq) and the TP is reached, I will watch Price Action closely. If it has high momentum, I will move SL to TP (15 points) and will watch the price. Looking for a higher TP, but usually no more than 50 points.
I trade manually, so not using any Expert Advisors.
For the month of September I do not consider changing lots size. I will trade flat and review after month is done.
4. Psyche
If I hit SL with the first trade, then 5 mins break.
If I hit SL 2nd time in a row, stop trading that instrument that day.
I should prepare and aim for the goal with the minimum number of trades, ideally with the 1st and only trade.
If I hit TP for that instrument, I should cash in profits and quit that instrument that day unless very high momentum on the price, then SL to 15 points and watch the price.
I am not interested in what does the price do after I leave the market, I focus only on my setup.
5. Goals
My goal would be each week ended on the plus. Hence each month should be positive.
My end and final goal should be total control of my emotions, consistency and good discipline when it comes to my strategy.
Only then I should try to increase the lots size for greater profits.
Please feel free to ask questions and comment/suggest things.
Best Regards,
Yrch
I will be posting MT4 screen shots each evening with my trades, notes as to why I traded and any ideas/suggestions for future.
Below assumptions and methodology, I will be updating this as I go along.
1. Instruments
I trade only Dax and Nasdaq CFDs at the cash open which is 9:00 am CET and 15:30 CET respectively.
I trade M1 timeframe.
I trade max 1h after the cash market open.
Spread for both is 1 point in the above timeframe.
I might not be able to trade Nasdaq every single day due to other commitments, but I should be able to trade Dax daily.
2. Strategy/methodology
I use only:
- Significant Suppport/Resistance (S/R) on the M15 for the last 3 days
- Fibo retracement levels for the first swing after cash market opens plus any further when significant move occured
- Round figures i.e. full hundreds (higher priority) and 50s e.g. 12100 and 12150 for Dax and 7400 and 7450 for Nasdaq
- High Value Area (usually 1 min of trading) as significant S/R
- Pivot Points and Support and Resistance from PP
I will be trading Price Action around these significant number/levels, so I might trade bounces off these levels or break out of them.
Sometimes I might also trade in the consolidation.
3. Money Management
SL is 10 points. I will move SL to Break Even once the price moves in the direction of a trade for 3 points.
TP is 15 points. Obviously it will depend on the price action and what I see when candles are being drawn.
If the movements is significant (which often happens on Nasdaq) and the TP is reached, I will watch Price Action closely. If it has high momentum, I will move SL to TP (15 points) and will watch the price. Looking for a higher TP, but usually no more than 50 points.
I trade manually, so not using any Expert Advisors.
For the month of September I do not consider changing lots size. I will trade flat and review after month is done.
4. Psyche
If I hit SL with the first trade, then 5 mins break.
If I hit SL 2nd time in a row, stop trading that instrument that day.
I should prepare and aim for the goal with the minimum number of trades, ideally with the 1st and only trade.
If I hit TP for that instrument, I should cash in profits and quit that instrument that day unless very high momentum on the price, then SL to 15 points and watch the price.
I am not interested in what does the price do after I leave the market, I focus only on my setup.
5. Goals
My goal would be each week ended on the plus. Hence each month should be positive.
My end and final goal should be total control of my emotions, consistency and good discipline when it comes to my strategy.
Only then I should try to increase the lots size for greater profits.
Please feel free to ask questions and comment/suggest things.
Best Regards,
Yrch