• Home
  • Forums
  • Trades
  • News
  • Calendar
  • Market
  • Brokers
  • Login
  • Join
  • User/Email: Password:
  • 7:45am
Menu
  • Forums
  • Trades
  • News
  • Calendar
  • Market
  • Brokers
  • Login
  • Join
  • 7:45am
Sister Sites
  • Metals Mine
  • Energy EXCH
  • Crypto Craft

Options

Bookmark Thread

First Page First Unread Last Page Last Post

Print Thread

Similar Threads

Hey, Newbie got some questions 12 replies

Hey all 1 reply

Hey! yellow news...??? 3 replies

hey all 11 replies

  • Trading Discussion
  • /
  • Reply to Thread
  • Subscribe
  • 295
Attachments: Hey...what about Volume?
Exit Attachments
Tags: Hey...what about Volume?
Cancel

Hey...what about Volume?

  • Last Post
  •  
  • 1 67Page 8910 39
  • 1 7Page 89 39
  •  
  • Post #141
  • Quote
  • Dec 30, 2017 5:06am Dec 30, 2017 5:06am
  •  sakisf
  • Joined Sep 2013 | Status: boreddddd | 3,136 Posts
Quoting stoxos
Disliked
{quote} In forums people say that in markets like ES and FX Futures there are not Market Makers, since they are a lot of people who biding or offering. Corn and others in-liquid markets have MM in CME. My personal opinion after what i have seen a lot of times,the DOM before a big news release or before a sudden move, 1-2 sec before movement, DOM will loose up to 70% of its volume. Suddenly you see only for couple of seconds the real liquidity provided buy people like me and you, you will see the big distance of our limit order will have. The reason...
Ignored
Every market in CME has MMs inside, even ES. Don't worry about them as they are only helping you get better spreads and fills. They sell liquidity in volumes through commission rebates. What you see in DOM is beefed up volume but you shouldn't worry about it, deltas, volume rates are still accurate as all MM positions are hedged. Just watch the T&S and notice how many basis contracts on bid and ask are never executed against each other.
 
2
  • Post #142
  • Quote
  • Dec 30, 2017 8:17am Dec 30, 2017 8:17am
  •  Trader-Waldo
  • | Membership Revoked | Joined Sep 2017 | 422 Posts
Quoting DonPato
Disliked
Hello again Friends.......
Ignored
Very long story short in summary by chicago board of trade in study guide to market profile:

"...All market activity occurs within this broad framework-with the
market moving up to shut off buying and down to shut off selling...."
NO MATTER THE SITUATION,NEVER LET YOUR EMOTIONS OVERPOWER YOUR INTELLIGENCE
 
3
  • Post #143
  • Quote
  • Dec 30, 2017 12:46pm Dec 30, 2017 12:46pm
  •  DonPato
  • Joined Dec 2015 | Status: Member | 1,509 Posts
Hello all,

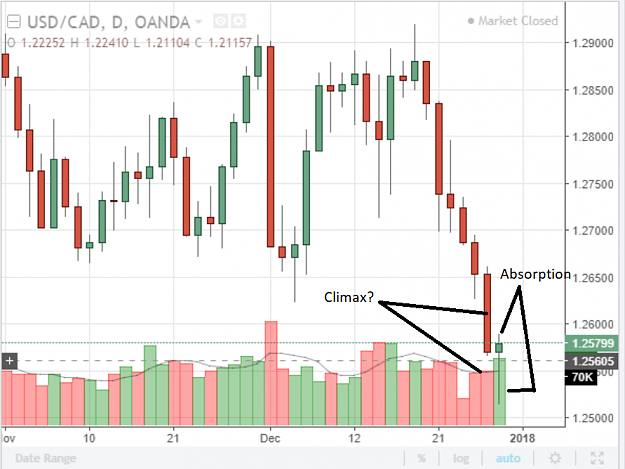
I thought I would show you all my thinking process on something that I am going to Stand down. Again, USD/CAD. After price broke through the 8 week range, I am expecting another run to test that range, and true to form an absorption candle has formed on Friday. Here is the screen shot.
Attached Image (click to enlarge)
Click to Enlarge

Name: 12-29-17-USDCAD.PNG
Size: 83 KB

Here is what I am seeing: I see a break of the range, on increasing volume...it is right at the level where it might be considered "climax" volume, but...eh!! Then yesterday's candle which shows increasing volume, and finished higher. AND, it failed to close below the low of the previous candle.

Here is what I am NOT seeing: No exhaustion phase. You know that phase that is most difficult to define, especially here with tick volume. However, I usually define it as: price continues to move in the direction of dominance but on less and less volume. I don't see that here. As well, the heretofore mentioned "climax" volume is what I would consider very borderline and not convincing.

I suspect that the absorption phase occurred only because this was the last trading day of 2017, and many were booking profits on this last move down to close out the year. I will wait until after the new year and revisit this decision. For now this is a "Stand aside" decision....tell me what you all think?
Do more of that which succeeds and less of that which does not - Dennis Gar
 
1
  • Post #144
  • Quote
  • Edited Dec 31, 2017 4:19am Dec 30, 2017 7:34pm | Edited Dec 31, 2017 4:19am
  •  Fader123
  • Joined Feb 2016 | Status: Member | 1,018 Posts
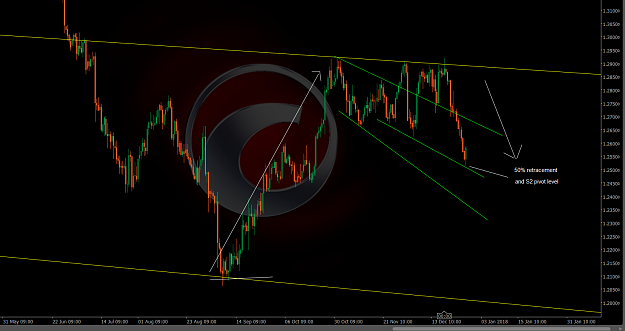
From a fundamental point of view -this is where we are at now
Looking ahead its a mixed picture.
CAD: Possibly oil might start coming off (pipelines being fixed). (Although inventory draws quite high at the moment)
USD: NFP estimates - lower on jobs and a bit higher on wages
The minutes are going to be important. They were dovish the last time, although the tone seemed optimistic - but not really about inflation.

Not really the best story to go long on. But on Tuesday traders will be looking at an oversold UC- bouncing off support with a pin bar

All of this is on the back of poor recent prints from the dollar and strong prints from the CAD over the last 10 days.

Anyway happy New Year
Attached Image (click to enlarge)
Click to Enlarge

Name: Screenshot1.png
Size: 164 KB
 
1
  • Post #145
  • Quote
  • Dec 31, 2017 6:19am Dec 31, 2017 6:19am
  •  kinspk
  • Joined Dec 2011 | Status: Alcoholic | 1,034 Posts
[Edit] Nice thread discussing volume.

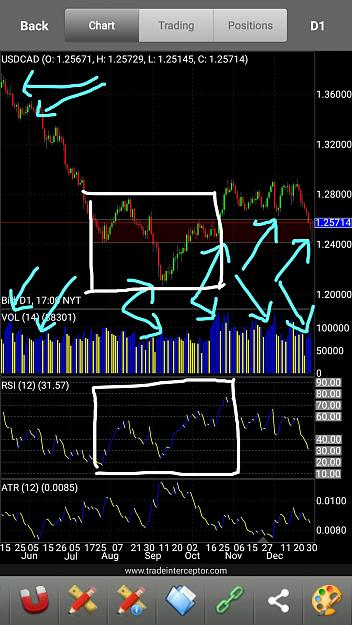
- Usually after a group lower volumes followed by a Group of Ascending Higher Volume, it build up toward a direction.
*Look at blue arrows on price and volume

- Rectangle box from 1.24~1.26, are place of interest where I call it demand and supply, as price direction may decide here. So it could break either side and fly.

- White square box are typical pattern of a 1st phase of bottom or top deciding phase. Outside the box are 2nd phase of continuing the direction.
*Look at white square box

- December Economic data had been much better for Cad than USD, so this bearish trend will most likely be temporarily.
*Set December calendar and take a look

Personal view bullish but will wait for lower to enter, as present price I'm not convince as 2nd bottom on Daily chart, but new start of the year 2018, I expect ranging.
Attached Image (click to enlarge)
Click to Enlarge

Name: IMG_20171231_185548.jpg
Size: 497 KB
The only winner is the one who survive the longest...
1
 
  • Post #146
  • Quote
  • Jan 1, 2018 8:02pm Jan 1, 2018 8:02pm
  •  headfake
  • | Joined Aug 2009 | Status: Member | 533 Posts
Quoting DonPato
Disliked
Hello all, I thought I would show you all my thinking process on something that I am going to Stand down. Again, USD/CAD. After price broke through the 8 week range, I am expecting another run to test that range, and true to form an absorption candle has formed on Friday. Here is the screen shot. {image} Here is what I am seeing: I see a break of the range, on increasing volume...it is right at the level where it might be considered "climax" volume, but...eh!! Then yesterday's candle which shows increasing volume, and finished higher. AND, it failed...
Ignored
I like your thread, I've been a price volume addict for quite a few years now and starting to get some mind blowing results.

What Iv'e found helps me understand price and volume is to gauge who's doing what, I tend to class PA now as either pro activity or weak holders and the distinction between the 2 camps is pro's understand orderflow and weak traders don't.

Anyway so on your chart the wh's would have bought the supp and then they where stopped out on the BO bar (second to last bar)which added strength to the down move - break out (wide down bar) and giving it the impression of a strong break south. And we need to also note the break out south would have brought in weak hands selling the break out thinking it to be a strong move south because of the weak buyers now being stopped out. So now we have weak hands opening sell positions but as you've pointed on the last bar volume has increased and price has closed up - a hammer bar. Higher volume means pro activity and since they are already open short then what's actually happening here is we're seeing decent pro profit taking and the weak hand BO sellers are again on the wrong side of the order flow.
Never said I was Batman,all I'm saying is you'll never see us together.
 
 
  • Post #147
  • Quote
  • Jan 3, 2018 1:59pm Jan 3, 2018 1:59pm
  •  DonPato
  • Joined Dec 2015 | Status: Member | 1,509 Posts
Hello Everyone...I hope you have a very happy and safe New Year's celebration. I have spent the holidays in productive mode. I have determined a set of definitions and criteria I will use to test my afore mentioned theories. I already have two trades in the data base and will add a third today.

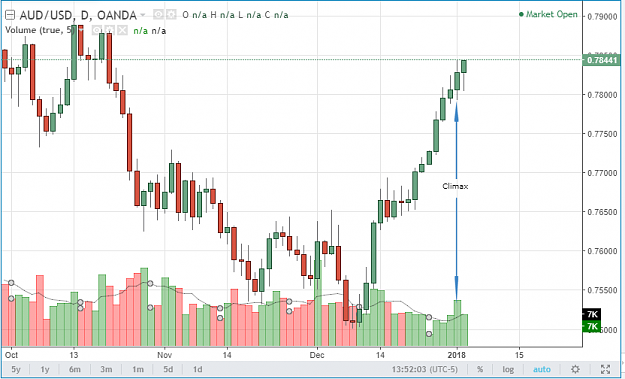
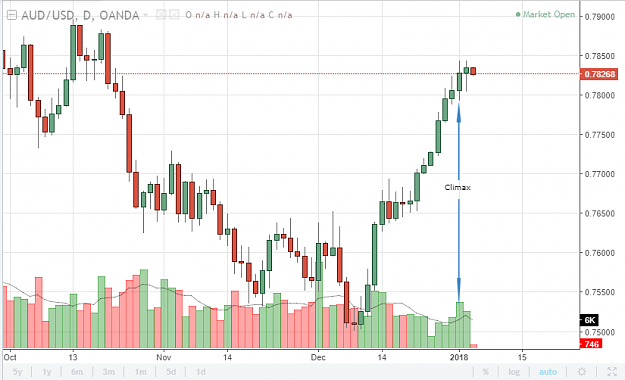
As well I thought I would share a screen shot of a trade I am stalking at present. AUD/USD (looking for a short).
Attached Image (click to enlarge)
Click to Enlarge

Name: Screenshot1.png
Size: 42 KB

As you can see here price has moved into an area I would expect to see some reaction and perhaps some selling or profit taking. Yesterday's trading brought about some climax buying in the tick activity. Today's tick activity is significantly less, yet price continues moving higher. We are currently sitting at yesterday's high and I expect we might close there or even a little higher. Assuming this is the case we might have the case for an exhaustion candle. I won't know until it closes and I can see the final tick count.

If not I will wait to see what happens in the next couple of days, especially tomorrow.
Attached Image

Considering that the majority of the retail market (as assessed here on FF) is short now, I expect there may be another climax up before a good signal appears. That will be all of these trading stopping and and possibly even turning bullish, as price "breaks out"
Do more of that which succeeds and less of that which does not - Dennis Gar
 
1
  • Post #148
  • Quote
  • Jan 3, 2018 2:37pm Jan 3, 2018 2:37pm
  •  SunTrader
  • Joined Mar 2006 | Status: Trade the reaction not the news! | 10,418 Posts
Quoting DonPato
Disliked
Another example...this time in forex: {image} even without the special coding to color the bars, you can see the tick volume drops off dramatically even as price reaches new highs...same can be said for the lows seen here...new lows...yet clearly NO volume. (momentum?, churning?, grinding?) NO! exhaustion
Ignored
Exactly.

As Tom DeMark says markets don't turn higher at a bottom because of more buying but less selling. Same but in reverse at tops.
 
 
  • Post #149
  • Quote
  • Jan 3, 2018 3:04pm Jan 3, 2018 3:04pm
  •  DonPato
  • Joined Dec 2015 | Status: Member | 1,509 Posts
Quoting SunTrader
Disliked
Exactly. As Tom DeMark says markets don't turn higher at a bottom because of more buying but less selling. Same but in reverse at tops.
Ignored
Not just that...but usually the first climax volume pushing price up and out of"the hole" is a wave of shorts exiting either stopping out or taking profit. The better question is, "who is selling to these buyers?" I try very hard NOT to be one of these participants.
Do more of that which succeeds and less of that which does not - Dennis Gar
 
 
  • Post #150
  • Quote
  • Jan 3, 2018 3:22pm Jan 3, 2018 3:22pm
  •  SunTrader
  • Joined Mar 2006 | Status: Trade the reaction not the news! | 10,418 Posts
Quoting DonPato
Disliked
{quote} Not just that...but usually the first climax volume pushing price up and out of"the hole" is a wave of shorts exiting either stopping out or taking profit. The better question is, "who is selling to these buyers?" I try very hard NOT to be one of these participants.
Ignored
Yes but that is ... after the selling ends. The heavy selling.
 
 
  • Post #151
  • Quote
  • Jan 3, 2018 4:28pm Jan 3, 2018 4:28pm
  •  shaqtrader
  • | Joined Aug 2017 | Status: Junior Member | 1 Post
Hi Don
What book is best to under volume in fx? I'm a complete newbie. Never made a live trade but I think volume and price are the way to go in trading.
I'm also looking for a mentor if anybody is interested.
 
 
  • Post #152
  • Quote
  • Jan 3, 2018 5:10pm Jan 3, 2018 5:10pm
  •  FXState
  • | Joined Jan 2016 | Status: Member | 117 Posts
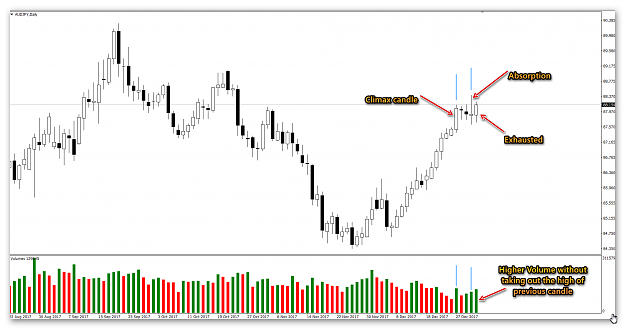
Hi Don, I hope my explanation is right about the stages in the attached image?
Attached Image (click to enlarge)
Click to Enlarge

Name: AUDJPY.png
Size: 112 KB
 
1
  • Post #153
  • Quote
  • Edited 6:39pm Jan 3, 2018 6:00pm | Edited 6:39pm
  •  Trader-Waldo
  • | Membership Revoked | Joined Sep 2017 | 422 Posts
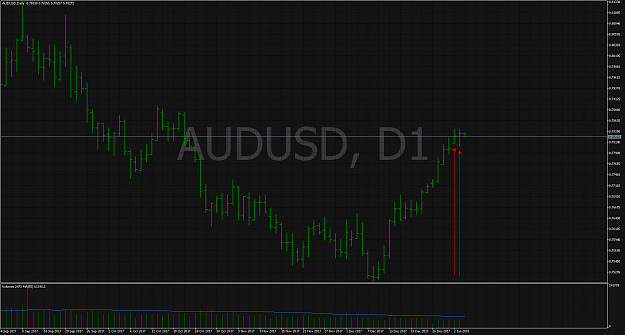
chart and volume on my chart are different then here.
Attached Image (click to enlarge)
Click to Enlarge

Name: AUDUSDDaily.png
Size: 96 KB
NO MATTER THE SITUATION,NEVER LET YOUR EMOTIONS OVERPOWER YOUR INTELLIGENCE
 
 
  • Post #154
  • Quote
  • Jan 3, 2018 6:29pm Jan 3, 2018 6:29pm
  •  DonPato
  • Joined Dec 2015 | Status: Member | 1,509 Posts
Quoting Trader-Waldo
Disliked
chart and volume on my chart are different then here. {image}
Ignored
Hi again Waldo...it looks like you are using mt4 is this correct? Try using the volume indicator in that platform. I've found it is easier to read and allows you to place a moving average on the volume (for comparison). Just color all the bars the same to avoid confusion with "bullish" or "bearish".
Do more of that which succeeds and less of that which does not - Dennis Gar
 
 
  • Post #155
  • Quote
  • Jan 3, 2018 6:37pm Jan 3, 2018 6:37pm
  •  DonPato
  • Joined Dec 2015 | Status: Member | 1,509 Posts
Quoting FXState
Disliked
Hi Don, I hope my explanation is right about the stages in the attached image?
Ignored
I think I understand, however I would call the three candle run up to your climax bar the exhaustion phase. I'm a little cautious of this set up because the absorption candle (yes I think you interpreted that correctly) occurred after the order flow balanced for two days. Maybe it was the holidays or something else but I'm not seeing the sellers come in on today's candle (open candle) and if you get a close up where it is now I think price will continue higher. Just my opinion... I don't trade this market (aud/jpy) so I am unfamiliar with it's quirps
Do more of that which succeeds and less of that which does not - Dennis Gar
 
 
  • Post #156
  • Quote
  • Jan 3, 2018 7:11pm Jan 3, 2018 7:11pm
  •  DonPato
  • Joined Dec 2015 | Status: Member | 1,509 Posts
Update on my stalking...
Attached Image (click to enlarge)
Click to Enlarge

Name: Screenshot1.png
Size: 39 KB

This days price reaction and tick activity did not qualify for "exhaustion" phase. Thus this is a stand down for now...unless I see something tomorrow that makes me sit up and take notice.

Unfortunately this is the nature of trading. You see something and want to trade SOMEthing but have to wait until it looks just right.
Do more of that which succeeds and less of that which does not - Dennis Gar
 
1
  • Post #157
  • Quote
  • Jan 3, 2018 7:41pm Jan 3, 2018 7:41pm
  •  DonPato
  • Joined Dec 2015 | Status: Member | 1,509 Posts
Quoting shaqtrader
Disliked
Hi Don What book is best to under volume in fx? I'm a complete newbie. Never made a live trade but I think volume and price are the way to go in trading. I'm also looking for a mentor if anybody is interested.
Ignored
You can start with "Time Compression Trading" by Jason Alan Jankowski. https://www.amazon.com/Time-Compress...alan+jankovsky

At the end of the book he listed a phone number (don't know if its still good) and I called him and he mentored me for about a year. It was paid mentoring but worth every cent. Also this guy who was active here on FF is also a personal friend. https://www.forexfactory.com/showthr...46#post8446246

Hope that helps. I am also available to chat online but please contact me privately. People here take a dim view of us "helping" others.
Do more of that which succeeds and less of that which does not - Dennis Gar
 
1
  • Post #158
  • Quote
  • Jan 3, 2018 8:55pm Jan 3, 2018 8:55pm
  •  LinkersX
  • | Membership Revoked | Joined Mar 2016 | 115 Posts
Quoting DonPato
Disliked
{quote} You can start with "Time Compression Trading" by Jason Alan Jankowski. https://www.amazon.com/Time-Compress...alan+jankovsky At the end of the book he listed a phone number (don't know if its still good) and I called him and he mentored me for about a year. It was paid mentoring but worth every cent. Also this guy who was active here on FF is also a personal friend. https://www.forexfactory.com/showthr...46#post8446246...
Ignored
#Linkers::X->Hello World;

Servers Revenge - How To Turn $200 to $100k in one month
Linkers::X->theNextBigThing; in C++ HFT Event Driven Algorithmic Trading
1
 
  • Post #159
  • Quote
  • Jan 3, 2018 9:18pm Jan 3, 2018 9:18pm
  •  DonPato
  • Joined Dec 2015 | Status: Member | 1,509 Posts
Quoting LinkersX
Disliked
{quote} #Linkers::X->Hello World; Servers Revenge - How To Turn $200 to $100k in one month
Ignored
HUH??!!
Do more of that which succeeds and less of that which does not - Dennis Gar
 
 
  • Post #160
  • Quote
  • Jan 4, 2018 10:10am Jan 4, 2018 10:10am
  •  FXState
  • | Joined Jan 2016 | Status: Member | 117 Posts
Quoting DonPato
Disliked
{quote} I think I understand, however I would call the three candle run up to your climax bar the exhaustion phase. I'm a little cautious of this set up because the absorption candle (yes I think you interpreted that correctly) occurred after the order flow balanced for two days. Maybe it was the holidays or something else but I'm not seeing the sellers come in on today's candle (open candle) and if you get a close up where it is now I think price will continue higher. Just my opinion... I don't trade this market (aud/jpy) so I am unfamiliar with...
Ignored

Thanks Don for the reply and the insight. I will keep learning how volume and price relate in FX.
 
1
  • Trading Discussion
  • /
  • Hey...what about Volume?
  • Reply to Thread
    • 1 67Page 8910 39
    • 1 7Page 89 39
0 traders viewing now
  • More
Top of Page
  • Facebook
  • Twitter
About FF
  • Mission
  • Products
  • User Guide
  • Media Kit
  • Blog
  • Contact
FF Products
  • Forums
  • Trades
  • Calendar
  • News
  • Market
  • Brokers
  • Trade Explorer
FF Website
  • Homepage
  • Search
  • Members
  • Report a Bug
Follow FF
  • Facebook
  • Twitter

FF Sister Sites:

  • Metals Mine
  • Energy EXCH
  • Crypto Craft

Forex Factory® is a brand of Fair Economy, Inc.

Terms of Service / ©2023