{quote} It looks like fibonacci is always happening because it puts 5 horizontal lines on the chart, .
Ignored
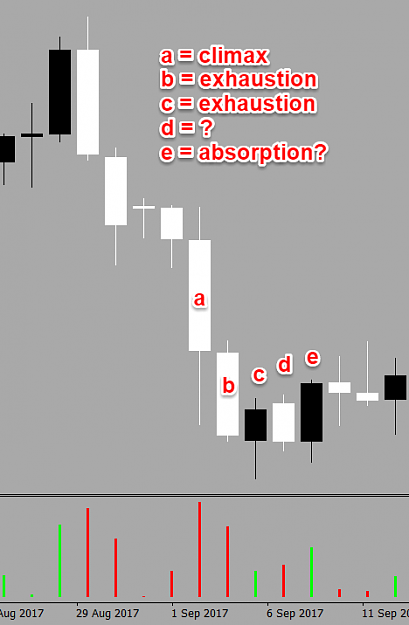
Yes and which one of those lines is the "correct" line to take action on? Answer: The one where the order flow exhausts in one direction and changes to a new direction...
Hi Don, i am here again ..
i am reading this thread and now at page5. I noticed this thread started in 2017 and you didn't use VP chart but regular price chart with volumn indicator to analyze price exhaustion,,etc
does VP chart not exists in FX market? or just you have not used VP chart yet 2 years ago?
and for another point, you said you will focus on how to 'translate' the knowledge in futures to the FX market in this thread.
as i only trade futures ,is the teaching in this thread still helpful to me?
BTW, i have not seen a thread which you focus on futures market, please show me if you ever wrote...
The same is true of the opposite side...if the buyers dry up first and go to zero...price will tick down, looking for more buyers....This will segue perfectly into my next post...Dominance.
Can i ask a language question here to confirm that i correctly understand the konowledge...
what is difference between "price will tick down" and "price will go down"?
does the former means the price will go down step by step?
and you mentioned if the amount of aggressive buyers go to zero, price will down to look for more buyers,
essentially because their is still remaining aggressive sellers , and they push price to do down, right?
{quote} Can i ask a language question here to confirm that i correctly understand the konowledge... what is difference between "price will tick down" and "price will go down"? ...
Ignored
I say this with great humility. I often forget that this forum has international readership and I am greatly humbled that my statements here would reach literally to the other side of the world. First of all, thank you for taking this information so seriously. Clearly you are trying to learn as much as possible from this thread. Thank you for your dedication to your craft.
The difference you are addressing truly is a language issue. Especially in English, we use many different words to convey the same meaning but each does carry a slightly different connotation that native language speakers don't truly appreciate.
Tick Down (or up). My meaning when I said that is that price will rise level by level...each time price changes even a 1/10 of a pip it is referred to in English as a "tick". Not to be confused with a transaction with is also referred to as a "tick". Same word different meanings. Tick up or down simply means that price moved up to the next level where liquidity was available. Sometimes that level is only one pip away, sometimes that next level may be several pips away depending on the amount of the liquidity available.
Move down or Go down (or up). Simply means literal price movements up and down. It is a more generalized form of saying "tick up (or down)". But in this instance I was using them interchangeably. In most cases they mean the same thing but often I will use the different terms to help better explain or be more precise (in English) without realizing the misunderstanding that may result for someone who's native language ISN'T English.
Always keep in mind that price will NOT move anywhere unless the aggressive side uses up ALL the available liquidity and each and every level.
Hi Don, i am here again .. i am reading this thread and now at page5. I noticed this thread started in 2017 and you didn't use VP chart but regular price chart with volumn indicator to analyze price exhaustion,,etc does VP chart not exists in FX market? or just you have not used VP chart yet 2 years ago? and for another point, you said you will focus on how to 'translate' the knowledge in futures to the FX market in this thread. as i only trade futures ,is the teaching in this thread still helpful to me? BTW, i have not seen a thread which...
Ignored
I started trading using only FX. And I imagine my path in trading was much like yours. I tried every "system" and mathematical formula out there. Anything you can think of I tried. I knew that order flow was responsible for price movements but just couldn't figure it out. During this time I (like many of you here) discounted FX volume because it wasn't "real" volume, only tick volume. So I continued to struggle against the inevitable financial demise I was facing, if I continued.
Then a friend convinced me to move to futures trading and for much the same reasons...volume was "real" volume and so I studied futures and in this market was actually able to see the order flow as it was posted up to the markets...this is because the futures market is transparent and must be accounted for at the end of every day.
I began to realize how the order flow and volume were actually responsible for price movements and simultaneously realized that is must be the same for every market regardless of its transparency. Thus my attempt to "translate" these lessons to FX trading. Admittedly the tools in Spot FX are less accurate and cruder simply because the market is decentralized and NOT transparent. Thus this opens the door for many disreputable brokers to "cheat" their way into taking your money. Most here are probably better traders than they realize but the lack of transparency and broker games are very likely making the difference between just profitable and losing.
So YES, I trade futures and YES I use volume and price to help me find the order flow. The newest tools I've been using are the Delta Volume Profiles and this is only recently that anyone has bothered to code them. Again it is a crude extrapolation because the tick data is not available in a central exchange like the futures market...or every other market for that matter. But it is far more accurate than just price and volume alone...And price and volume alone is far more accurate than EVERY other "indicator" or math solution you can think of.
Don, thanks for your kind reply. To be honest sometimes I am too obsessed with why a certain word appears in a sentence. i have realized that native speakers do not always talk according to rules of grammer
After I learn more knowledge here , I hope I can use VP chart to analyze some problems independently. now i find multicharts platform that I think it is ok, and it has built-in VP charts function. Wish i can post my analysis here in the near future. thank you!
{quote}And price and volume alone is far more accurate than EVERY other "indicator" or math solution you can think of. I hope this answers your questions
Ignored
Price, time, money supply are the most useful indicators to predict prices.
The volume is always an incomplete statistic in the largest "assets" and instruments. There isn't even a way to get all the contract volume for every price mechanism that calls itself Brent Crude Oil. Relative time is more important than volume, so is money supply and potential money supply.
Again I bring up the subject of "hedging" for those interested. Using this one simple rule: "Engage at the edges." This kind of trade is especially effective when a range is forming and we can't tell when, if, or which way it will break...in fact no one really "knows". So I engage at the edges as soon as I see the order flow begin to exhaust. I was long from the bottom and now just entered short from the top, as well has having a 2nd position waiting to be filled. Now...no matter which way the range breaks I will have a profitable trade. And once...
Ignored
Attached Image (click to enlarge)
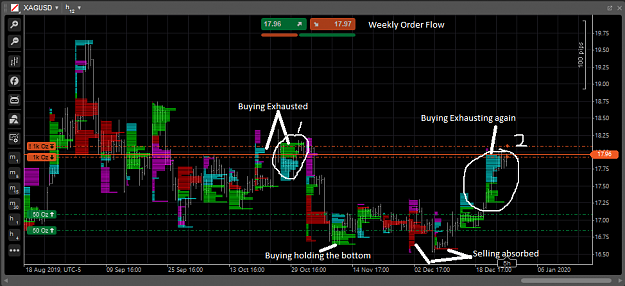
why signed buying exhaustion on circle 1&2?
i just see a lot of buying there and thought it was a sign of buying strength...
or normal buying only appears at the bottom of a bar, if large buying appears near the top so it can considered as a kind of UNNORMAL (considered as orderflow inversion which is a sign of swing point?)?
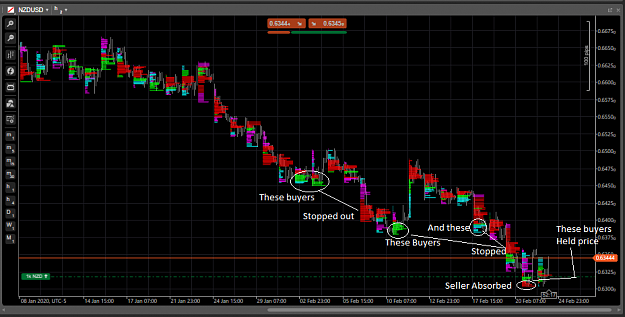
Just a look at NZD/USD. I was triggered last night (during the Asian session) Buyers have been driving price lower and lower for the last couple of weeks. Until it looked like Friday the late sellers (retail crowd) finally gave up and sold...their sells were quickly absorbed and prices are rising today. I'm confident prices will come back to retest this area...so let just wait and see...my entry is still very early. (I think)
why signed buying exhaustion on circle 1&2? i just see a lot of buying there and thought it was a sign of buying strength... or normal buying only appears at the bottom of a bar, if large buying appears near the top so it can considered as a kind of UNNORMAL (considered as orderflow inversion which is a sign of swing point?)?
Ignored
Ask yourself: How is price responding to the buying? If there is a large block of active (aggressive) buying, shouldn't price be rising?
Now ask yourself: If price is NOT rising in response to this buying why isn't it? Keep in mind these histograms can only show you the aggressive side of the market...they do not show the passive (liquidity side).
This is an area where you must "see" the answer for yourself...
hi there this thread has been amazingly interesting and i am fully convinced that order flow trading is the best way to go about this so thank you for this. I was wondering what you use to get the volume profiles as i have been looking but cant find these?
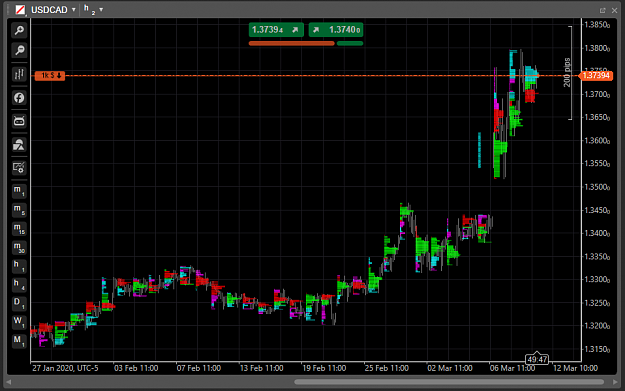
Looking at USD/CAD...All the bru-ha-ha over the corona virus has caused the CAD to fall to 2 year lows. And now it appears an order flow "inversion" is forming. I am in short with a small position
Looking at USD/CAD...All the bru-ha-ha over the corona virus has caused the CAD to fall to 2 year lows. And now it appears an order flow "inversion" is forming. I am in short with a small position {image}
Ignored
I think by 1.285 will see much red on your new chart. price for USD/CAD although I agree completely that reward/risk probability is better sell-USD/CAD. Figure OIL will rebound to $45 after accumulating for a few months around $35.
{quote} OK...now I am back in the office and have a far more informed view of this market that you asked me to assess. {image} Note first: the selling exhaustion phases that appeared and also coincided with the bottom of a well established range (9 weeks in the making). Of particular interest is that the absorption phase was "hidden" inside the large bearish candle that formed the last bottom. It would have been indistinguishable except that the delta volume profile allowed it to stand out...a large block of selling that could NOT push price any...
Ignored
Hi, Don
I am a little unclear about your analysis here...
first.. "a large block of selling that could NOT push price any lower", i only saw the large block of selling near the bottom, and with a little green(by the way , whats these small green/buying stands for ?) ,but I don't see how this massive selling resulted in the price not falling? Are you observe the gray price bars that beside the chart to identify this?
Next: ovbious inversion. i wonder that should i say "this inversion shows the orderflow starts to turn to buying dominance,causing this swing low and leading a rise in price" or should i consider this "in a down-trend backgroud, we see an abnormal inversion here, so this is a sign of price change of direction"
finally, yes i indeed see a large of buying in several candles, but how do you identify these buying are shorts stopping out but not just new longs coming in?
thanks!
|
Joined Aug 2019
|
Status: As clueless as you
|9 Posts
This is an excellent thread. Something worth considering and integrating into one's playbook. NNFX on Youtube also stands by the use of volume to determine trade entries. Bravo, DonPato. And thank you.
.
Ignored