GBPUSD Weekly Technical Outlook
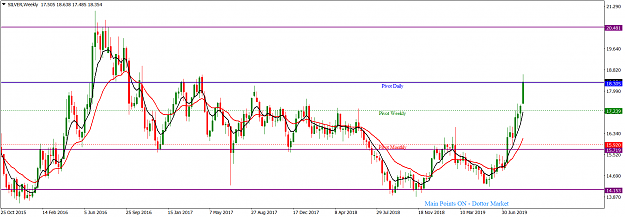
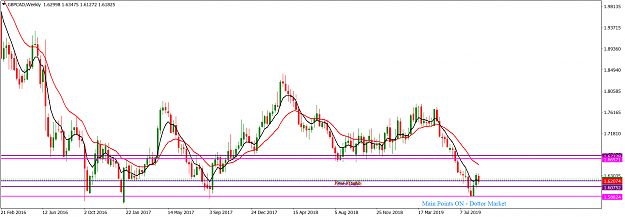
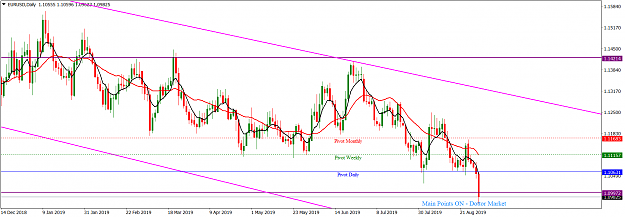
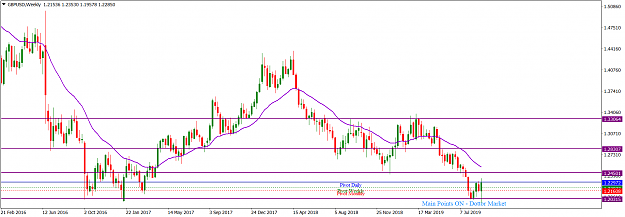
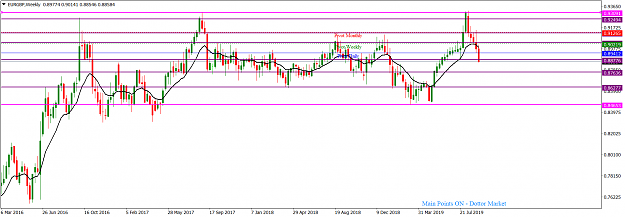
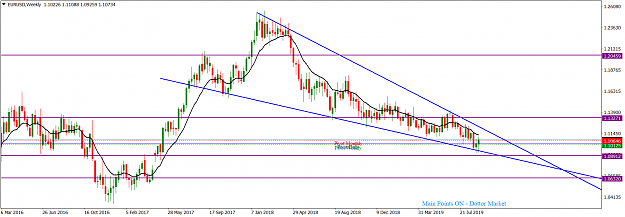
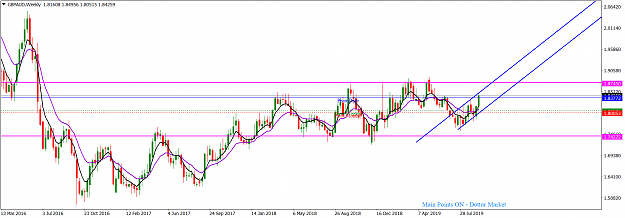
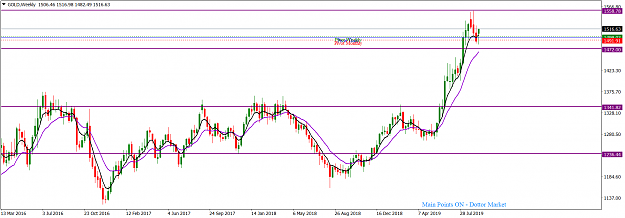
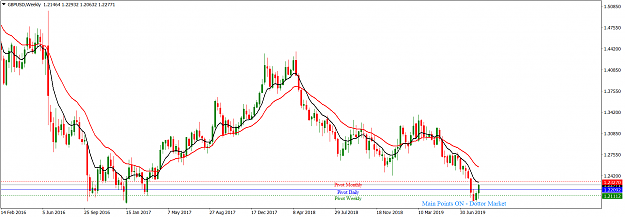
The GBPUSD market printed consecutive bullish candlesticks on the weekly time frame in the past two weeks just after price action entered a significant horizontal support zone around the 1.19980 area. Price action is presently located around a horizontal resistance area, which may witness some sideways operation in the early part of this week. Should bulls successfully breach the resistance, the 1.24250 area is likely to be next barrier for bulls to handle.
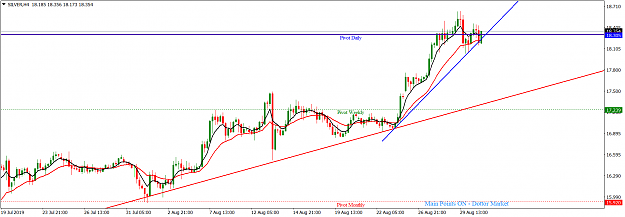
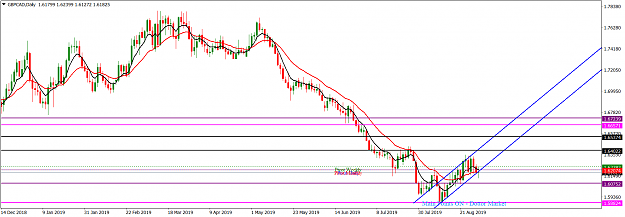
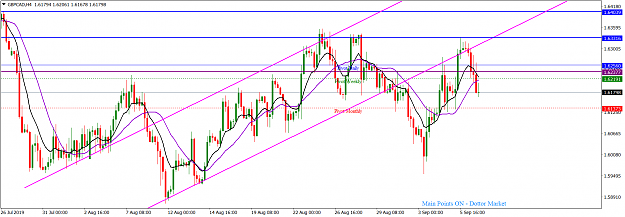
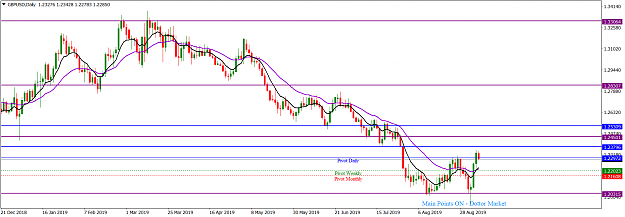
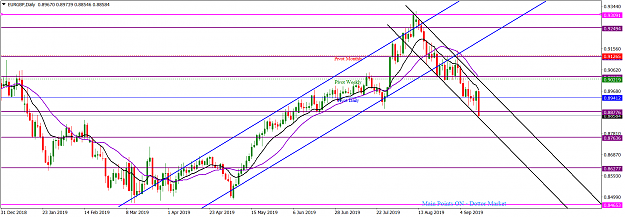
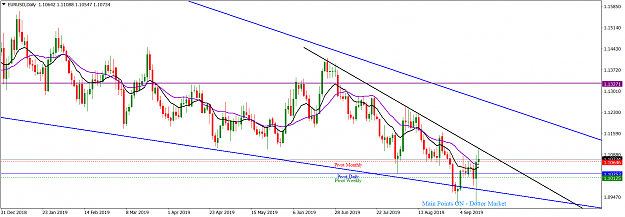
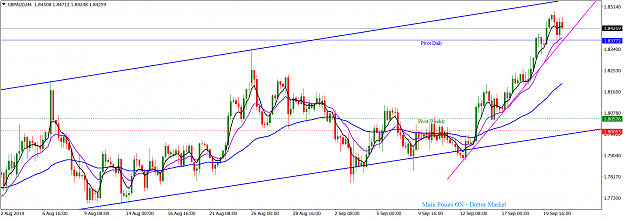
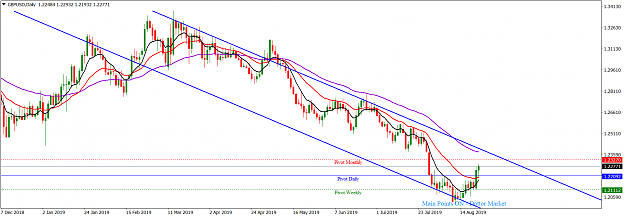
A falling channel (blue) is in operation on the daily time frame. Presently, bulls are taking price operation northwards within the channel. But they are likely to face a few barriers; for example, the monthly pivot around 1.23270, which adjoins a minor horizontal resistance; and then the channel resistance trendline. At any rate, the technicals support a northward move in the short term; but in the medium term, bears will be poised for a southward continuation.
I may be wrong. Trade safe and prosper.
KP
The GBPUSD market printed consecutive bullish candlesticks on the weekly time frame in the past two weeks just after price action entered a significant horizontal support zone around the 1.19980 area. Price action is presently located around a horizontal resistance area, which may witness some sideways operation in the early part of this week. Should bulls successfully breach the resistance, the 1.24250 area is likely to be next barrier for bulls to handle.
Attached Image (click to enlarge)
A falling channel (blue) is in operation on the daily time frame. Presently, bulls are taking price operation northwards within the channel. But they are likely to face a few barriers; for example, the monthly pivot around 1.23270, which adjoins a minor horizontal resistance; and then the channel resistance trendline. At any rate, the technicals support a northward move in the short term; but in the medium term, bears will be poised for a southward continuation.
Attached Image (click to enlarge)
I may be wrong. Trade safe and prosper.
KP
Do your homework, follow the footprints of smart money
3