Quoting PipRippyDislikedBemac- I have some questions about the fantail indicator. I started searching for material that pertained to the fantail and the only thing I could find was in some Darryl Guppy newsletters. In the newsletters he makes some comparisions between his Guppy Multiple Moving Averages (shorterm 3,5,8,10,12,15 and longterm 30,35,40,45,50) and a indicator he calls the rainbow. The indicator at first glance looks like the fantail. I am assuming that you are familar with Guppy's indicators because they are so similar to the fantail and you posted some of his indicators.
He makes a claim that the rainbow indicator is not as reliable as his Guppy indicator. He goes on about how it lags and it does not react fast enough. However, you cannot make the same claim about the fantail because it uses multipla variable ma's correct? The comparision of guppy to fantail is not valid because of the difference in the use of variable ma's.
So if anybody reads those articles and clumps the fantail indicator with the rainbow indicator- they are making a technical error. The fantail will react quicker during consolidation (adx falling) and tighten up during a trend (adx rising).
My second question has to do with the ADX part of the fantail. I am assuming that the variable, or the multiple, is the actual adx result?
If it is below 20-25 price is non-trending- above 25 and rising trend starting. So when a trend develops, the ADX rises, also making the variable ma's longer, so they stiffen up to display the trend more consistent.
I just want to make sure that I am thinking correctly while comparing the two indicators.
Thanks for all your hardwork!
RippyIgnored
I would say that is a very concise and accurate comparison between Fantail and Guppy.
Actually, Fantail {a tropical fish variety of Fancy Guppy} is a derivative of GMMA designed to reduce the whip of {all, but particularly} the Shorter {Traders} MA's while still maintaining the integrity of the Indicator.
After defining Wilder's ADX, I then use Tuchar Chande's Variable MA formula to make the MA's dynamic.
From Daryl Guppy {Trader}
The inferred activity of traders is tracked by using a group of short term moving averages. The traders always lead the change in trend. Their buying pushes up prices in anticipation of a trend change. Their activity is shown by a 3, 5, 8, 10, 12 and 15 day group of exponentially calculated moving averages.
The trend survives only if other buyers also come into the market. Strong trends are supported by long term investors. The investor takes more time to recognize the change in a trend but he always follows the lead set by traders. We track the investors' inferred activity by using a group of long term moving averages. This group is 30, 35, 40, 45, 50 and 60 day exponentially calculated moving averages.
Mr. Guppy explains this while dealing with Daily Stock Charts in which his MA Periods would make more sense.
Traders MA Periods
03 ~ 0.5 Weeks.
05 = 1.0 Weeks.
08 ~ 1.5 Weeks.
10 = 2.0 Weeks.
12 ~ 2.5 Weeks. {Not sure why it's not 13 but you figure it out}
15 = 3.0 Weeks.
Long Term Group MA Periods starts at
30 = 6.0 Weeks.
If you are using Guppy on Daily Forex, imho, that progression should be adjusted to... 03, 06, 09, 12, 15, 18.
The Long Term MA Periods should also be adjusted accordingly to accomodate 6 Day Weeks {not 5} 36, 42, 48, 54, 60, 66.
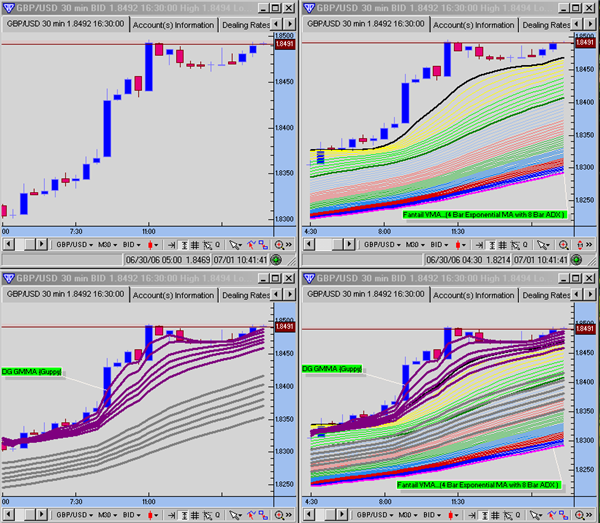
Attached is a 30 Minute GBP/USD for Fantail & Daryl's Guppy comparison.


