• Home
  • Forums
  • Trades
  • News
  • Calendar
  • Market
  • Brokers
  • Login
  • Join
  • User/Email: Password:
  • 1:18pm
Menu
  • Forums
  • Trades
  • News
  • Calendar
  • Market
  • Brokers
  • Login
  • Join
  • 1:18pm
Sister Sites
  • Metals Mine
  • Energy EXCH
  • Crypto Craft

Options

Bookmark Thread

First Page First Unread Last Page Last Post

Print Thread

Similar Threads

Systems, Systems and Systems... 1 reply

VTTrader: Indicator Discussions for VT Trader 49 replies

VTTrader: Rich's Trading Systems and Indicators 17 replies

VTTrader: Systems Discussions for VT Trader. 8 replies

VTTrader: Simple Forex System and VtTrader 5 replies

  • Trading Discussion
  • /
  • Reply to Thread
  • Subscribe
  • 64
Attachments: VTTrader: New Indicators & Trading Systems Only: No Discussions please
Exit Attachments
Tags: VTTrader: New Indicators & Trading Systems Only: No Discussions please
Cancel

VTTrader: New Indicators & Trading Systems Only: No Discussions please

  • Last Post
  •  
  • Page 1 23 4
  • Page 1 23 4
  •  
  • Post #1
  • Quote
  • First Post: Edited Jun 20, 2006 12:40pm Jun 12, 2006 7:59pm | Edited Jun 20, 2006 12:40pm
  •  Bemac
  • Joined Jan 2006 | Status: Monarch o' the Glen | 5,561 Posts
Please keep this thread clear of all discussions on Indicators and Trading systems as this thread is intended as a Download area only. If you would like to discuss a particular Indicator or TS please use the appropriate thread or start a new one.

If you have an Indicator or TS you would like to post...

Whether it is an Indicator or TS
A brief Description of how to use it
An image

Would, I'm sure, be appreciated by all.

Thanks to all.
Attached Image
Attached File(s)
File Type: vtscr _WormHole.vtscr   4 KB | 894 downloads
  • Post #2
  • Quote
  • Jun 16, 2006 3:47am Jun 16, 2006 3:47am
  •  richx7
  • | Joined Nov 2005 | Status: Member | 166 Posts
Here is the XMA indicator that I like to use for viewing trends shown in 15min GBP US. It is shifted -10 and extrapolates the missing current bars. It is based on a post by Vadim.

A suggestion - this part of the forum should have folders for each indicator.
Attached Image
Attached File(s)
File Type: vtscr XMA.vtscr   1 KB | 706 downloads
 
 
  • Post #3
  • Quote
  • Jun 16, 2006 9:31am Jun 16, 2006 9:31am
  •  Bemac
  • Joined Jan 2006 | Status: Monarch o' the Glen | 5,561 Posts
Guppy MA's by twoblink Posted June 16th 06

http://www.forexfactory.com/forexforum/showpost.php?p=66734&postcount=1
 
 
  • Post #4
  • Quote
  • Jun 16, 2006 11:56am Jun 16, 2006 11:56am
  •  Bemac
  • Joined Jan 2006 | Status: Monarch o' the Glen | 5,561 Posts
Hi Folks,

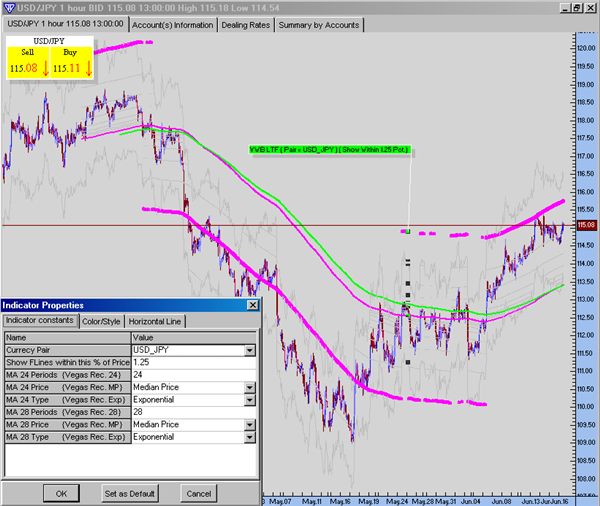
One of the nice things about VT is that you are not limited to a maximum of 8 outputs [plots] in an Indicator or Trading system.

This allows us to calculate all relevant Fibonacci Pip Levels in one indicator which, in turn, negates having to plot multiple Indicators to get all the information we need.

Just select the Currency Pair your are applying it to & it will determine the "Important Fibonacci Line" for that pair.

Notice that it may take a little longer to load than MT4 but remember you are actually, in effect, applying multiple Indicators.

In the attached Indicator I have made a minor graphic modification {controlled by user input} to forbid plotting lines if they are beyond the Important Fibonacci Line and too far away from the current Price Action to be of interest..
Why? To avoid squishing the Chart unnecessarily.

Indicator in next Post.

Image.
Attached Image
 
 
  • Post #5
  • Quote
  • Jun 16, 2006 11:58am Jun 16, 2006 11:58am
  •  Bemac
  • Joined Jan 2006 | Status: Monarch o' the Glen | 5,561 Posts
VWB Daily VT Indicator.
Attached File(s)
File Type: vtscr VWB_Daily_VT.vtscr   2 KB | 707 downloads
 
 
  • Post #6
  • Quote
  • Jun 16, 2006 12:12pm Jun 16, 2006 12:12pm
  •  Bemac
  • Joined Jan 2006 | Status: Monarch o' the Glen | 5,561 Posts
With a little work to the VWB Daily VT Code, you can plot a Close Appriximation of the same Tunnel on charts down to 30 minutes.

Please make sure you have a minimum of 1500 bars on a 30 min Chart before attaching this indicator.
Attached Image
 
 
  • Post #7
  • Quote
  • Jun 16, 2006 12:13pm Jun 16, 2006 12:13pm
  •  Bemac
  • Joined Jan 2006 | Status: Monarch o' the Glen | 5,561 Posts
VWB Daily for Lower Timeframes VT Indicator
Attached File(s)
File Type: vtscr VWB_Daily_LwrTimes_VT.vtscr   2 KB | 581 downloads
 
 
  • Post #8
  • Quote
  • Jun 16, 2006 8:16pm Jun 16, 2006 8:16pm
  •  Bemac
  • Joined Jan 2006 | Status: Monarch o' the Glen | 5,561 Posts
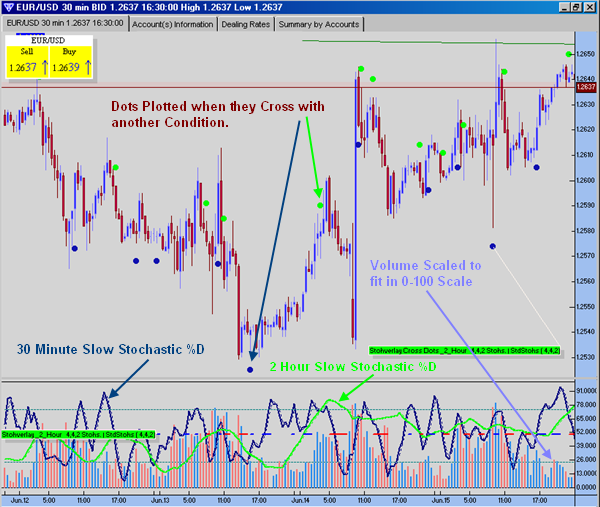
The image below has Two Indicators plotted.

1) The Lower Frame. Overlayed Stohs VT
A 4,4,2 Slow Stochstic %D plotted on a 30 Minute Chart with a 4,4,2 Slow Stochstic %D Plotted as it would appear on a 2 Hour Chart. The Higher Timeframe Stoh can be any Standard Timeframe you chose from 5 Min to 8 Hours as long as it is Higher than the Base Chart Timeframe.

The re-scaled Volume Indicator changes colour based on Higher/Lower Close.

2) The Price Frame.
Overlayed Stoh Dots VT
Mostly the same code with different ouputs to Plot Dots showing when the 2 Stochastics Cross And the 30 Min [base] is above/below the trigger lines.

Attached Image
 
 
  • Post #9
  • Quote
  • Jun 16, 2006 8:18pm Jun 16, 2006 8:18pm
  •  Bemac
  • Joined Jan 2006 | Status: Monarch o' the Glen | 5,561 Posts
The Indicators.
Attached File(s)
File Type: vtscr Overlayed_Stoh_Dots.vtscr   2 KB | 682 downloads
File Type: vtscr Overlayed_Stohs.vtscr   2 KB | 621 downloads
 
 
  • Post #10
  • Quote
  • Jun 18, 2006 11:32am Jun 18, 2006 11:32am
  •  Bemac
  • Joined Jan 2006 | Status: Monarch o' the Glen | 5,561 Posts
A Wild Variation on a Popular Tropical Fish Theme

Readers Digest Version in Bold @ Bottom.


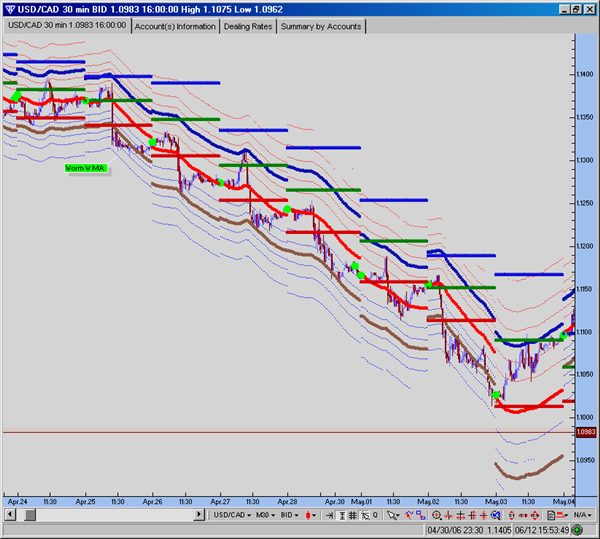
Recently I have been working a little with GMMA [Guppy] and found it quite interesting.
{google Daryl Guppy for more info}

But, as always, after taking it apart I had a difference of opinion in how it was actually being calculated.

I wanted to plot it on a 30 min Chart and so that's where I started.
This is a quote from one of the many sites that google turned up. {google chart finder for the rest of the quote}
[quote]
The inferred activity of traders is tracked by using a group of short term moving averages. The traders always lead the change in trend. Their buying pushes up prices in anticipation of a trend change. Their activity is shown by a 3, 5, 8, 10, 12 and 15 day group of exponentially calculated moving averages.

The trend survives only if other buyers also come into the market. Strong trends are supported by long term investors. The investor takes more time to recognize the change in a trend but he always follows the lead set by traders. We track the investors' inferred activity by using a group of long term moving averages. This group is 30, 35, 40, 45, 50 and 60 day exponentially calculated moving averages.
The GMMA is used in six trading situations

[End Quote]

Cool, but what does 3, 5, 8, 10, 12 or 15 bar EMA tell me on a 30 min chart?
They equate to a 1 1/2 Hour, 2 1/2 Hour, 4 Hour, 5 Hour 6 Hour & 7 1/2 Hour EMA's

So I changed it to 4, 8, 12, 16 & 24 Hours.
The second set I treated with a similar progression.
Then I added 6 more sets based in the same format.

It looked pretty good but I realized I prefer Variable MA's to any of the others.


So... I changed it again.This time I went with a Variable MA & hung on a 4 bar EMA with an 8 bar ADX Period as the BASE MA. Then I took a 2, 4, 6, 8... up to 100 period EMA of that Original Var MA.
WHY?
No matter what timeframe you hang it on [ above 10 min & below daily] , it will {I believe} be comparing relevent periods in time.


I've identified what I think are 3 important MA's by making them thicker than the rest.
This is what you get.
Attached Image
 
 
  • Post #11
  • Quote
  • Jun 18, 2006 11:34am Jun 18, 2006 11:34am
  •  Bemac
  • Joined Jan 2006 | Status: Monarch o' the Glen | 5,561 Posts
The Indicator.
Attached File(s)
File Type: vtscr Fantail_VMA.vtscr   2 KB | 793 downloads
 
 
  • Post #12
  • Quote
  • Edited 12:58pm Jun 20, 2006 12:52pm | Edited 12:58pm
  •  Bemac
  • Joined Jan 2006 | Status: Monarch o' the Glen | 5,561 Posts
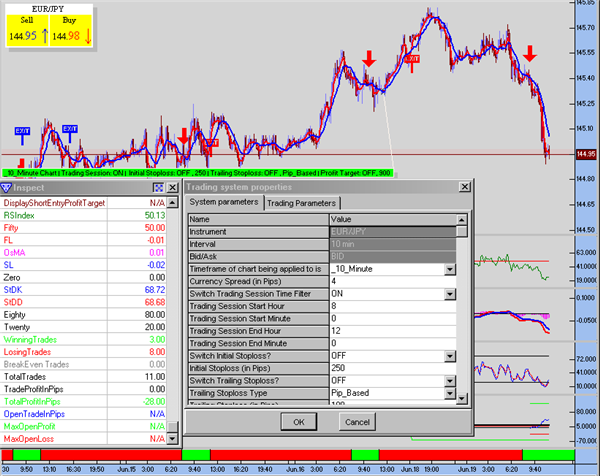
The link is to the discussion of this Trading System.

http://www.forexfactory.com/forexforum/showpost.php?p=67116&postcount=3
Attached Image
Attached File(s)
File Type: vttrs KFx10.vttrs   4 KB | 619 downloads
 
 
  • Post #13
  • Quote
  • Jun 20, 2006 1:54pm Jun 20, 2006 1:54pm
  •  Bemac
  • Joined Jan 2006 | Status: Monarch o' the Glen | 5,561 Posts
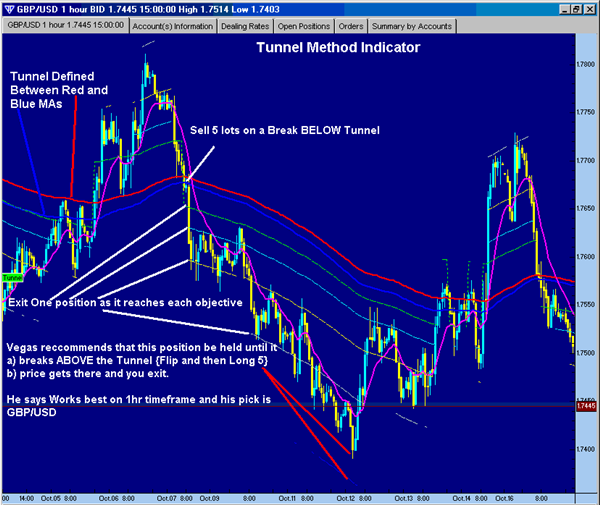
Indicator Image.
Attached Image
 
 
  • Post #14
  • Quote
  • Jun 20, 2006 1:55pm Jun 20, 2006 1:55pm
  •  Bemac
  • Joined Jan 2006 | Status: Monarch o' the Glen | 5,561 Posts
Vegas 1 Hour Tunnel Indicator
Attached File(s)
File Type: vtscr Tunnel.vtscr   1 KB | 893 downloads
 
 
  • Post #15
  • Quote
  • Jun 22, 2006 2:21pm Jun 22, 2006 2:21pm
  •  Bemac
  • Joined Jan 2006 | Status: Monarch o' the Glen | 5,561 Posts
Hi,

This little indicator just lets you look at an MA as it would appear on a Higher Timeframe Chart.

The example below shows a 14 SMA as it would appear on a 4 Hour Chart even though you are actually looking at a 30 Minute Chart.

The resulting MA is very close but may not be exact as the Average of 112 Closes on a 30 Minute Chart may not be exactly the same as the Average of 14 Closes on a 4 Hour Chart.
Attached Image
 
 
  • Post #16
  • Quote
  • Jun 22, 2006 2:23pm Jun 22, 2006 2:23pm
  •  Bemac
  • Joined Jan 2006 | Status: Monarch o' the Glen | 5,561 Posts
The Indicator.
Attached File(s)
File Type: vtscr B_Timeframe_MA.vtscr   2 KB | 556 downloads
 
 
  • Post #17
  • Quote
  • Jun 25, 2006 12:35am Jun 25, 2006 12:35am
  •  Bemac
  • Joined Jan 2006 | Status: Monarch o' the Glen | 5,561 Posts
Hi Folks I've posted this before but can't "Move" that post to here so I will repost it here & delete the other if requested.

In one of his Documents, Vegas mentioned...
1) Currency Pairs have their "Normal Daily Range from High to Low."
2) After the initial Pit squable about which direction today is going to take,
you should be able to hitch a ride for the remainder {this indicator will allow you to go for any percetage} of that range.

It should only be applied to Timeframes Lower than Daily to visualize that concept.

The first thing it does is look back through the bars on your chart and calculate the Highest DAILY Pip Range[HDR] on that chart.
Then it does the same for the Lowest DAILY Pip Range [LDR]on that chart.
It then calculates the Median of those two values[MDR]. {Note, This is not an MA}
That puts a value on the Daily Median Pip Range. [the pip difference we can Reasonably Expect Between TODAYS Day High & Day Low.}

Then it says, OK Yesterday is done. Tell me how High it will have to go from today's low to meet the Median Daily Pip Range.
But I' also want to know how Low it will have to go from today's High to meet the Median Daily Pip Range.
{those are the fine dotted red lines}

Now, I say, I'm pretty smart [read Vegas after all] , If, the price moves MY INPUT PIPS ABOVE the Open {the upper heavy dk grey line}, I figure it has a chance of continuing and running to the Dayly Pip Range High{the fine Blue Dotted Line} so Get me in Long.

On the other hand,
If, the price moves MY INPUT PIPS BELOW the Open {the lower heavy dk grey line}, I figure it has a chance of continuing and running to the Dayly Pip Range Low {the fine Red Dotted Line} so Get me in Short.

It then says, Guess what, the low just got lower so, If your Daily Pip Range is accurate, This is Now the highest it will get from that new low hence the fine lines {Potential Hi&Lo Tgts} move to reflect the MDR distance between Lowest Low & Highest High.

I know that sounds too tough to try to assimilate but if you have a look at it on a chart, I think you will see that it is a very simplistic and yet has potential.

The Image.
Attached Image
 
 
  • Post #18
  • Quote
  • Jun 25, 2006 12:38am Jun 25, 2006 12:38am
  •  Bemac
  • Joined Jan 2006 | Status: Monarch o' the Glen | 5,561 Posts
The Indicator.
*Please Note*
After Import,
it will be Named "__Daily Open Range" in your Custom Indicator list.
Attached File(s)
File Type: vtscr DORng.vtscr   2 KB | 625 downloads
 
 
  • Post #19
  • Quote
  • Edited Oct 21, 2006 12:51pm Jul 2, 2006 2:59am | Edited Oct 21, 2006 12:51pm
  •  Bemac
  • Joined Jan 2006 | Status: Monarch o' the Glen | 5,561 Posts
Hi Folks,

In an effort to reduce the amount of time it takes to code a Trading System in VT Trader, this template was designed to reduce not only repetative code entry but also the knowledge required of VT Trader language and functions etc.

Basically all you have to do is define your indicator with your Long Entry/Exit criteria and your Short Entry/Exit criteria

If you are just starting out on your coding education I would suggest that after you dnld this template, clone a work copy and save the original unaltered.

Kudos to Claude, Chris & the gang.
Attached File(s)
File Type: vttrs _FULL_TEMPLATE_Trading_System_06.vttrs   4 KB | 565 downloads
File Type: vttrs _FULL_TEMPLATE_Trading_System_08.vttrs   5 KB | 508 downloads | Uploaded Oct 21, 2006 12:51pm
 
 
  • Post #20
  • Quote
  • Edited Jul 6, 2006 10:29am Jul 4, 2006 9:11pm | Edited Jul 6, 2006 10:29am
  •  Claude
  • | Joined Mar 2005 | Status: Member | 88 Posts
Here's the squeeze indicator.

Attached File(s)
File Type: vtscr SqueezeATR.vtscr   2 KB | 635 downloads
A truly wise man, always has more questions than answers.
 
 
  • Trading Discussion
  • /
  • VTTrader: New Indicators & Trading Systems Only: No Discussions please
  • Reply to Thread
    • Page 1 23 4
    • Page 1 23 4
0 traders viewing now
  • More
Top of Page
  • Facebook
  • Twitter
About FF
  • Mission
  • Products
  • User Guide
  • Media Kit
  • Blog
  • Contact
FF Products
  • Forums
  • Trades
  • Calendar
  • News
  • Market
  • Brokers
  • Trade Explorer
FF Website
  • Homepage
  • Search
  • Members
  • Report a Bug
Follow FF
  • Facebook
  • Twitter

FF Sister Sites:

  • Metals Mine
  • Energy EXCH
  • Crypto Craft

Forex Factory® is a brand of Fair Economy, Inc.

Terms of Service / ©2023