- Search Forex Factory
- 257 Results (5 Threads , 252 Replies )
-
 PipMeUp replied Sep 11, 2023
Unfortunately you have to slice because despite the trend is overall zero it is made of a succession of up, then down, then up trends... You don't trade the average, you average the trades. In math terms the limit of the expectancy is different from ...
A Simple Mean Reversion Strategy
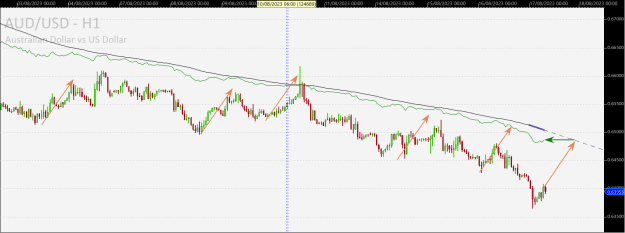
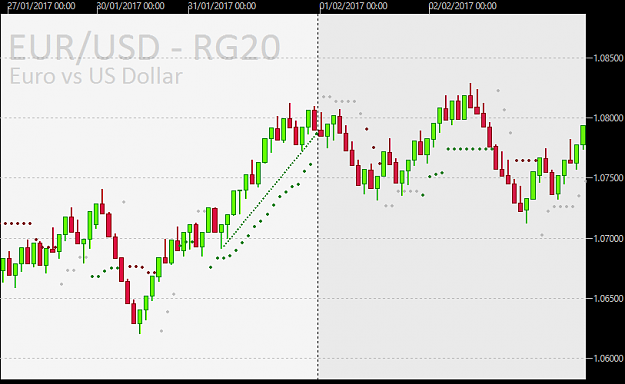
- PipMeUp replied Sep 10, 2023
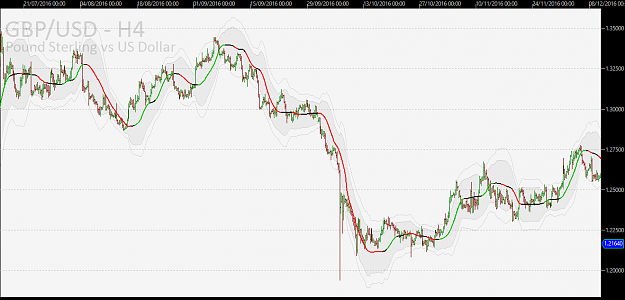
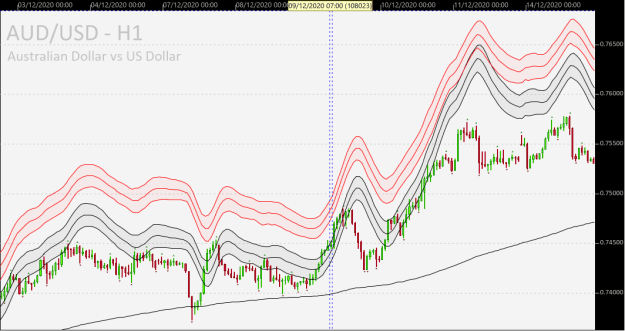
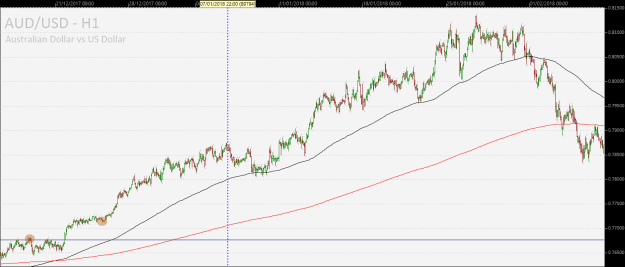
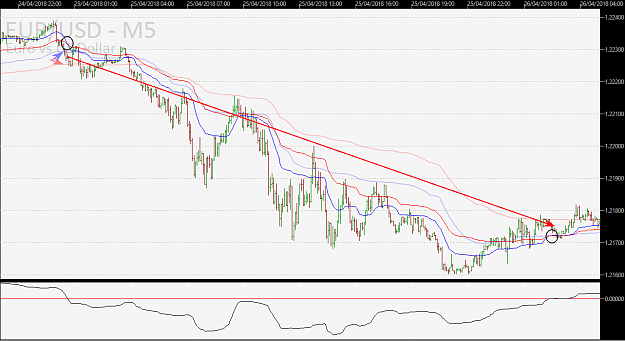
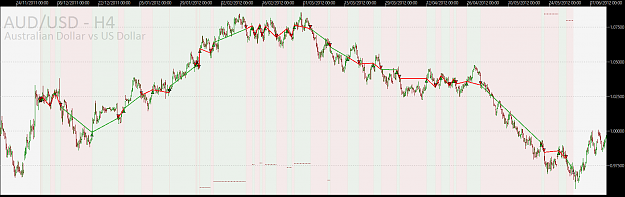
In this situation the price is mainly below the black EMA200 line. You will mainly enter long trades during this down trend and the price will often require that you average down. image With the "forecast" -- which like FXEZ underlined I admit is ...
A Simple Mean Reversion Strategy
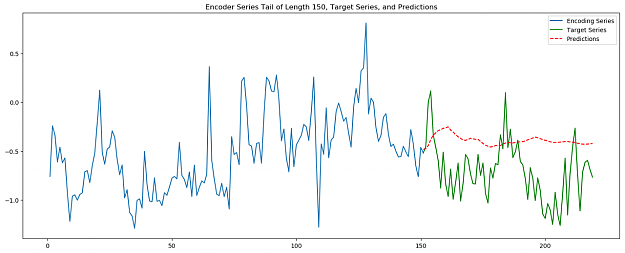
- PipMeUp replied Sep 8, 2023
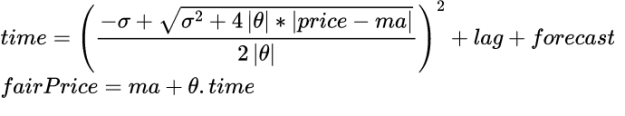
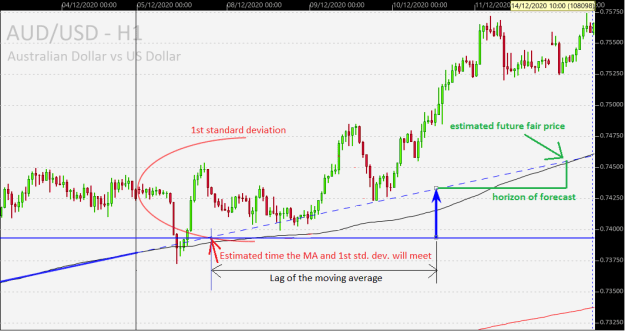
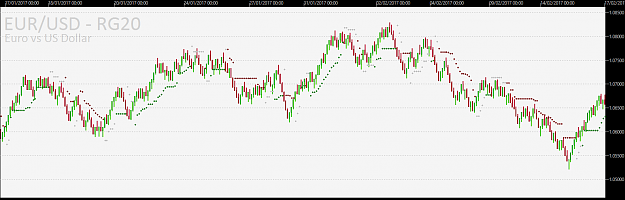
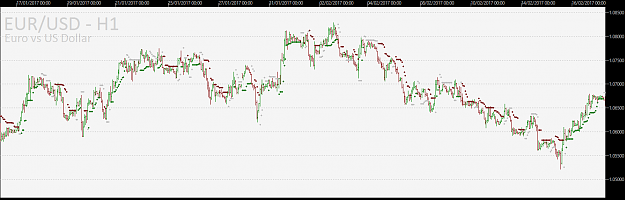
Like yoriz did (btw thanks for the details and the video!), I wondered if it would be interesting to trade the future fair value instead of the current MA. My idea was to use the standard deviation (over 200 samples) to estimate where the price has ...
A Simple Mean Reversion Strategy
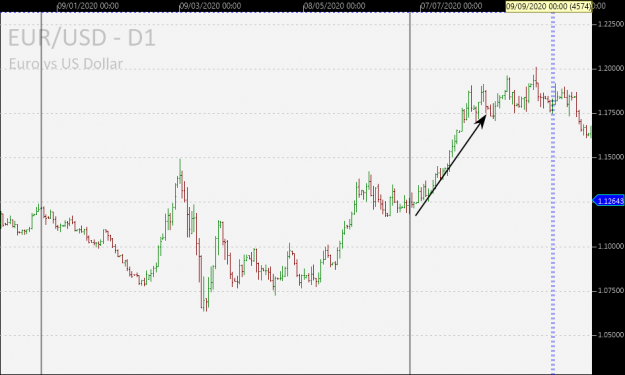
- PipMeUp replied Sep 1, 2023
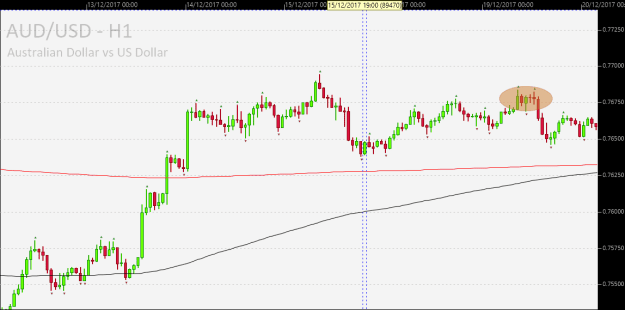
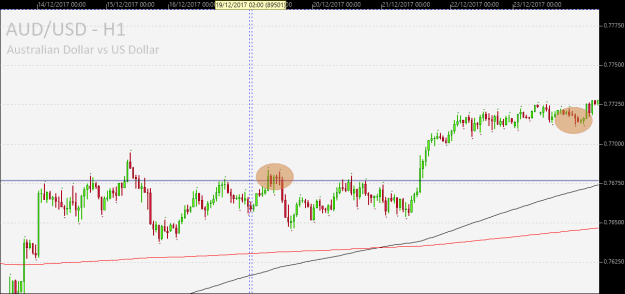
Not what I meant. Say you enter somewhere in the orange bubble: image But theta is consummed and you add somewhere in the second orange bubble: image How do you manage/mitigate this? image In this example the price had a nice pullback to close ...
A Simple Mean Reversion Strategy
- PipMeUp replied Aug 25, 2023
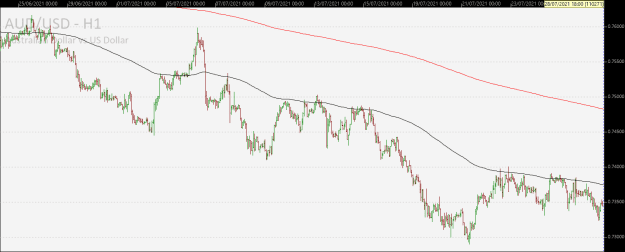
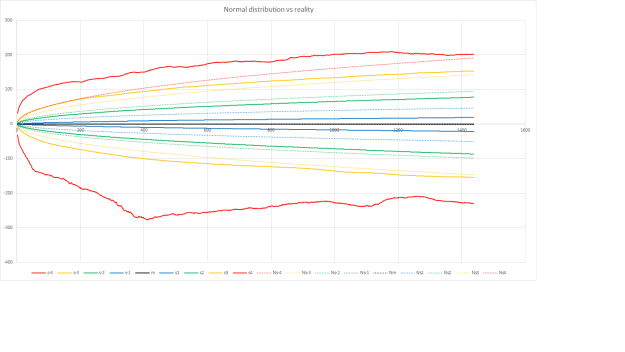
Same stats but for 2014-2018 to not include the covid period. Now the negative 4-th sigma is due to the downtrend of A/U over this period. image
A Simple Mean Reversion Strategy
- PipMeUp replied Aug 25, 2023
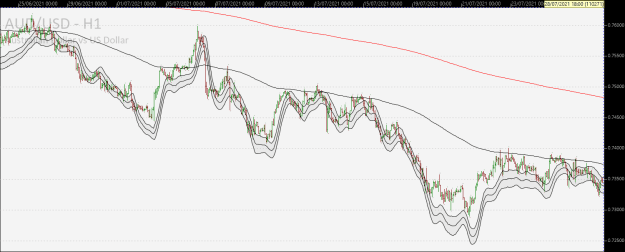
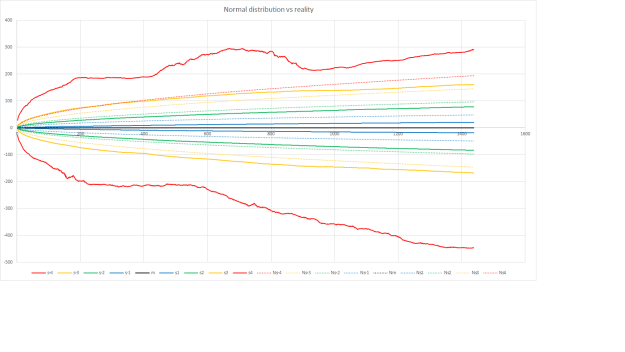
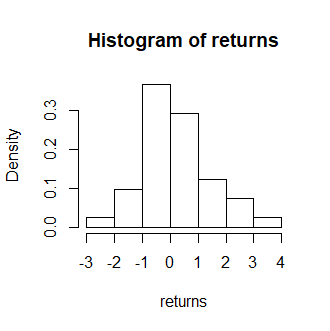
Here is my version of the same data but going to 4th sigma (red). Solid lines are reality and dotted lines assume a normal distribution. I think fat tail is clearly visible ;-) Also visible is the covid-19 effect on the negative 4th sigma image ...
A Simple Mean Reversion Strategy
- PipMeUp replied Aug 17, 2023
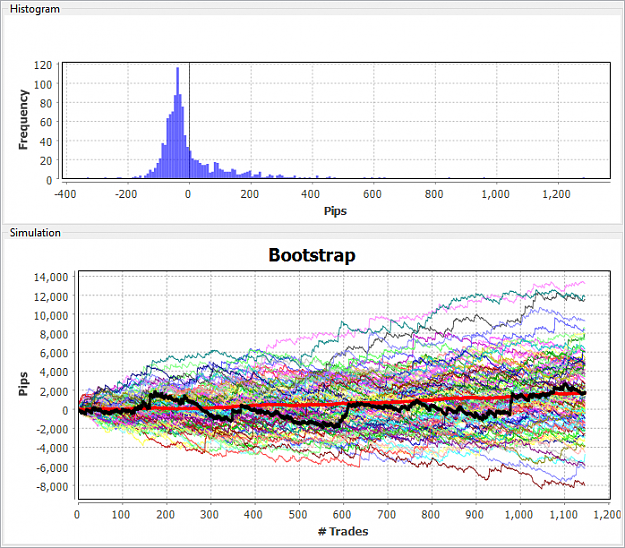
Hi, I made a bit of stats on A/U H1. Nothing very surprising. - The max gap is approx. 1200 pips (8 oct 2008). - Theta is correlated to the spread. This makes sense because of the lag of a moving average (distance to the MA is the trend times the ...
A Simple Mean Reversion Strategy
- PipMeUp replied Dec 22, 2021
I see your graph as a noisy image in parameter space. Running a low pass filter (blur) on it was my first idea. I took your data and applied a 5x5 uniform kernel on it (a 2D SMA). You can see that the lucky peak gets averaged out. Then I spotted (in ...
Finding The Most Robust Parameters Using Optimization

- PipMeUp replied Jun 7, 2020
Perhaps you should start now, in parallel. I can see some reasons for this. The first one is to avoid taking the problem by the wrong end. I mean you will end up with a NN which will provide some prediction. In the end of the day, that's just an ...
Deep learning prediction with DeepMind's Wavenet architecture
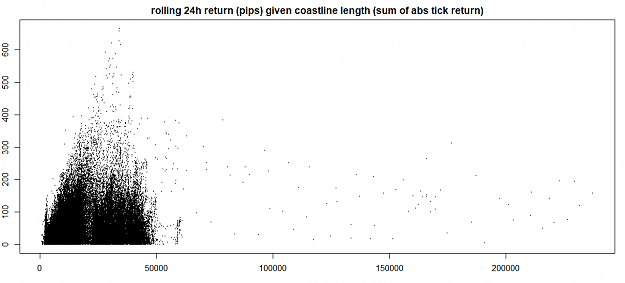
- PipMeUp replied Dec 11, 2018
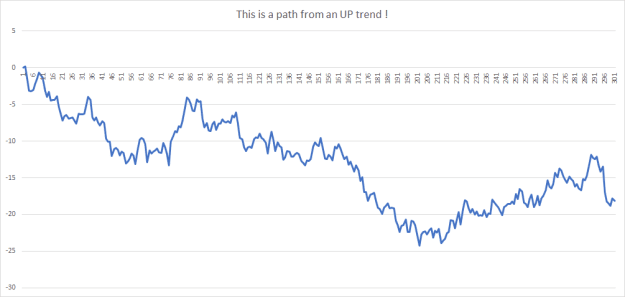
I was puzzled by the question so I took my ticks database for EUR/USD. I measured the path length (sum of absolute tick returns) over all periods of 24 hours starting at every hour. It isn't really a range vs trend classification but the bigger the ...
Simple Mean Reversion
- PipMeUp replied Oct 12, 2018
Since all of your "e-learning courses" are $199.99 / $10 each may you please post your scam in the commercial section? (Seriously 10 bucks to show how to implement a simple K-mean with R!!) Either you share OR you sell! image
Learn Computer and Data Science with Algorithmic Trading

- PipMeUp replied Sep 20, 2018
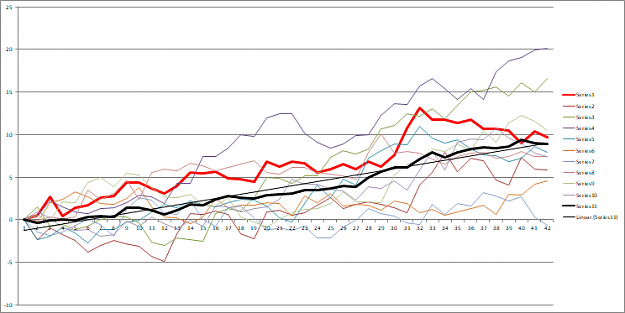
When an animal is too colorful is it often poisonous. When the package is too colorful is it often marketing :-) Would you really eat those pastel colored spaghetti? Can I really trust this Monte Carlo thingy? Let's have some fun. Here is a bunch or ...
Systematic Portfolio Diversification - Data Mining Concept

- PipMeUp replied Sep 3, 2018
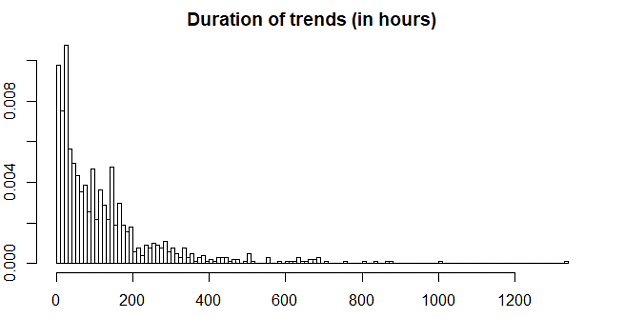
The duration of the trends, estimated here with the slope of a long period MA, follow a Poisson distribution. This means that the vast majority of the trends are short lived. A big fish can be 5 to 10 times longer. By closing at the average duration ...
Trend Trading
- PipMeUp replied Jun 3, 2018
I see you use a higher TF KAMA cross to filter the trades. I also tried this and the results were even worse because the strat can no longer catch many of the big fishes: they get filtered out. This one is rejected! image
Diversified Trend Trading Approach
- PipMeUp replied Jun 3, 2018
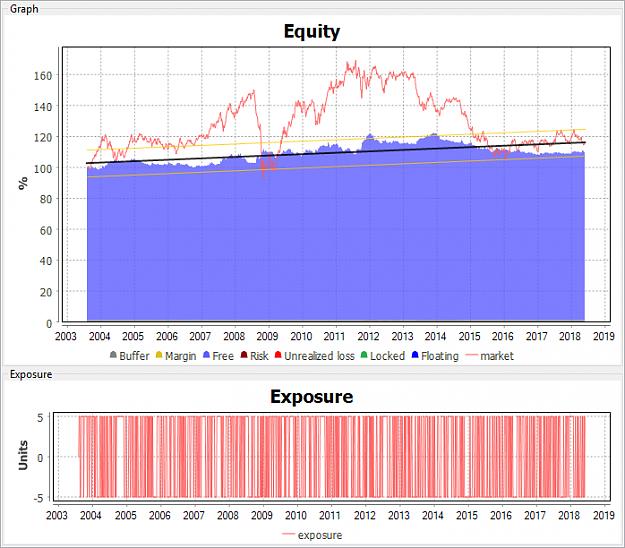
With all the philosophical discussions you had with VEEFX I lost the thread about the instant karma strategy. I'd like to replicate the results you posted. I read that you added a DC3000 as a filter but it is unclear how you use it. I quickly built ...
Diversified Trend Trading Approach
- PipMeUp replied May 18, 2018
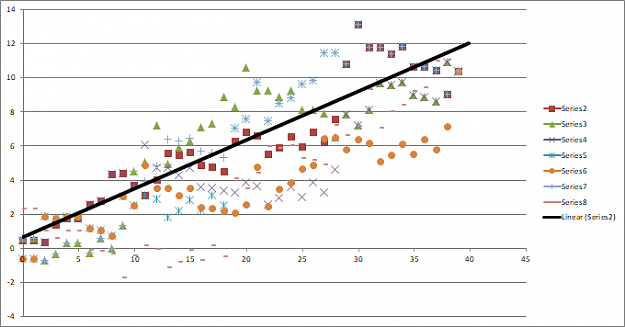
I love it when there is no parameters in an indi. When everything is data driven. - Mann-Kendall Test tells you the probability that some monotonic trend, non necessarily linear, exists in a dataset. - Theil-Sen estimator tells you what is the slope ...
Diversified Trend Trading Approach
- PipMeUp replied May 18, 2018
When you filter a sin wave with a SMA of exactly the same period the positive values of the sin cancel out with the negative ones. The output is flat. If the signal is a trend plus a sin wave you recover the trend. Of course if there are more than ...
Diversified Trend Trading Approach

- PipMeUp replied May 17, 2018
This is more or less what KAMA does. For the MA in this post url I do this: The Goertzel algorithm measures the power at a specific frequency in a discrete signal. I build 74 such filters each tuned to a period between 2 and 75. At the same time I ...
Diversified Trend Trading Approach
- PipMeUp replied May 17, 2018
In a trending market the price gets far from a MA. If the lag of your MA is constant at all frequencies (linear phase) and if the trend is constant (straight line) you can show that the distance is proportional to the trend. Even if it is not the ...
Diversified Trend Trading Approach