• Home
  • Forums
  • Trades
  • News
  • Calendar
  • Market
  • Brokers
  • Login
  • Join
  • User/Email: Password:
  • 9:41pm
Menu
  • Forums
  • Trades
  • News
  • Calendar
  • Market
  • Brokers
  • Login
  • Join
  • 9:41pm
Sister Sites
  • Metals Mine
  • Energy EXCH
  • Crypto Craft

Options

Bookmark Thread

First Page First Unread Last Page Last Post

Print Thread

Similar Threads

Trading correlation pairs by using the other pairs 736 replies

MT4 MTF Correlation table and Correlation oscillator indicators 155 replies

Alternative Trade Management/Money Management Methods 1 reply

Money Management / Risk Management 24 replies

Money Management applied to cross currency pairs 2 replies

  • Trading Discussion
  • /
  • Reply to Thread
  • Subscribe
  • 10
Attachments: Pairs correlation and Money Management
Exit Attachments

Pairs correlation and Money Management

  • Last Post
  •  
  • 1 Page 2
  • 1 Page 2
  •  
  • Post #21
  • Quote
  • Aug 24, 2013 10:37am Aug 24, 2013 10:37am
  •  PipMeUp
  • Joined Aug 2011 | Status: Member | 1,305 Posts
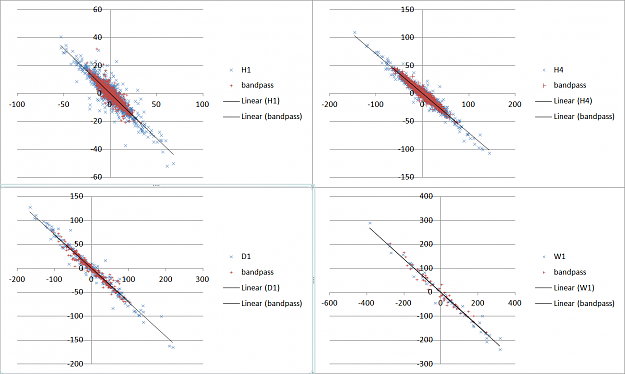
Let's see how the sampling influences the real life data. I took the data from E/U versus U/CHF over 2012. The reason for this choice is the SNB peg on EUR/CHF. When a central bank maintains EUR/CHF at almost exactly 1.2000, E/U and U/CHF can only be perfectly correlated since EUR/CHF = EUR/USD / USD/CHF at any time. This very special situation gives me a reference for 2 perfectly correlated pairs. Thank you SBN!

In regard to the previous post I removed the trend and the noise with a IIR Butterworth band pass filter (band 0.2 - 0.6 normalized frequency if you want to know; code from http://www-users.cs.york.ac.uk/~fisher/mkfilter/). The results are in the picture. Remarkably the regression is almost exactly the same with and without the filtering for the 4 TF I tested. After filtering the data is more compact (they are the red dots).

I mesure the alignment of the cloud on the trendline with the formula 1-squareRoot(e2/e1). Where e1 and e2 are respectively the first and the second eigenvalues of the co-variance matrix. I also mesure the regression coefficient (the slope of the regression line). For the dataset I expect 1 for the dispersion, i.e. a perfect cointegration, as any move of one pair must be counter-balanced by the other one to keep EUR/CHF constant. The result are
W1 - regression 0.70 - cointegration 0.90
D1 - regression 0.71 - cointegration 0.89
H4 - regression 0.70 - cointegration 0.84
H1 - regression 0.64 - cointegration 0.83

W1 which has got the smallest set of samples is surprisingly the nearest of the expected cointegration index with 0.9. Daily gives the same result. H4 and H1 don't perform very well.
The regression is the same for W1, D1 and H4. This consensus seems to lead to the thinking 0.7 is somewhat the correct value. H1 is completely off.

D1 and W1 are the two best TF to mesure my risk index. Daily contains more samples and will react more quickly so now on I'll use D1.
Attached Image (click to enlarge)
Click to Enlarge

Name: EURvsCHF.png
Size: 89 KB
No greed. No fear. Just maths.
 
 
  • Post #22
  • Quote
  • Edited Sep 20, 2013 12:17am Sep 19, 2013 9:50pm | Edited Sep 20, 2013 12:17am
  •  FXEZ
  • Joined Jan 2007 | Status: developing... | 970 Posts
Quoting PipMeUp
Disliked
Let me give an example. Say you trade G/U and E/U. You regress cable on fiber and get G/U = alpha * E/U + beta + epsilon. 7bit uses alpha to balance the basket. 1 lot E/U and -alpha lots G/U. When the long E/U goes up, the short G/U goes down the same $$ value. They neutralize. The profit is generated by epsilon, the imbalance of the basket. I don't care alpha and beta. I focus on epsilon. The variance of epsilon tells me how good the regression is. They search a set of pairs that minimizes epsilon to get a safe basket.
Ignored

I'm late coming to this thread - following link from other thread. Just to clarify the math, the typical regression equation should read:

G/U = alpha + E/U * beta + epsilon

where alpha is the intercept / trend, beta is the slope / size to trade per pair, and epsilon is the random error or variance.

And yes you are typically minimizing epsilon to get a better fit in regression / cointegration. And beta (not alpha) is typically the size traded in a cointegration / pairs trading application to balance or weight the pairs of the basket.

Quote
Disliked
Here I have the exact opposite goal. I'm looking for the biggest variance of epsilon to get the most independent basket so I can trade both pairs in parallel. But I know I'll never get a totally independent basket... If epsilon has a very low variance, the correlation is almost perfect (the dots lay on the regression line) and you will almost always get the same signal on both pair. With the same result.

Maybe I'm missing something but by maximizing the variance of the regression don't you also increase the variance of your resulting equity curve? Let's say instead of pairs, we are talking about regressing trading systems to produce some optimal combination of equity curves. By maximizing the variance of the regression of the equity curves, doesn't the resulting equity curve also take on the same variance characteristics as the underlying regression (high)? Or is this just another way of saying "trade unocorrelated systems together?"

Quote
Disliked
You shall halve the risk. Give each trade $250 to risk $500. (or just trade one single pair with $500). Say that when you get this simultaneous signal you wish to set your SL below the previous low. Naturally, in this case, the SL on G/U will be alpha times the one on E/U (the swing is alpha times bigger). Accordingly, the lot size will be divided by alpha. The lot sizes and the SL will differ but the risk (SL x lots) is $250 for both. Now what is beautiful is that if epsilon has a huge variance, the pairs have their own life and you can risk $500...

Have you tried maximizing the variance of a regression in practice to confirm the results? I may have to try this out myself.

(Edit) From my tests so far it appears to increase the variance of the output of the regression in almost every case. But I am seeing how this might be useful in other ways.
 
 
  • Post #23
  • Quote
  • Sep 20, 2013 4:58am Sep 20, 2013 4:58am
  •  PipMeUp
  • Joined Aug 2011 | Status: Member | 1,305 Posts
Quoting FXEZ
Disliked
the typical regression equation should read: G/U = alpha + E/U * beta + epsilon
Ignored
Didn't you just swap alpha and beta? They are just literals you can call them teddyBear and fooBar that would be the same to me you know.
computer scientist = mathematician - rigor

Quoting FXEZ
Disliked
Maybe I'm missing something but by maximizing the variance of the regression don't you also increase the variance of your resulting equity curve?
Ignored
I'm not trying to build a basket where you simulateously open a position in all the pairs. I want a set of pairs which are as much different as possible in order to trade several pairs at the same time with the same system while limiting the risk of being long at the same time and based on the same signal on both Kiwi and Aussie which are like brother and sister.

The real goal is to spot the strongest currencies and the weakest ones to pair them. I'd like to create a (time varying) watchlist of only 3 pairs made of a strong against a weak. They would summarize the 28 possible crosses. So I can direct a trend follower to pairs with a good potential to trend strongly.

The system enters and exits according to its own rules. It isn't required to trade exclusively in the direction of the expected trend or to trade at all. After all at the time I detect a currency is very strong it is possibly in overbought zone. If two pairs are sufficiantly different the two instances of the systems will have their own life. That's what I want to follow Hanover's idea http://www.forexfactory.com/showthread.php?t=11926

Quoting FXEZ
Disliked
Have you tried maximizing the variance of a regression in practice to confirm the results?
Ignored
No yet. I'm blocked for now.

So far I found out that daily is the best TF to mesure the correlation and the co-integration. I used to use H4. I want to thank SNB for the EUR/CHF peg that offered me a perfect test bench ;-)

But I still have a problem with correlation vs co-integration. When you look at the charts of two very correlated pairs they look almost the same. But you can find low correlated pairs which are highly co-integrated. Their charts don't look the same. One can trend up and the other down. Yet the swings turning points happen at the same time. I don't know how to objectively mesure how different they are.
No greed. No fear. Just maths.
 
1
  • Post #24
  • Quote
  • Sep 21, 2013 7:39am Sep 21, 2013 7:39am
  •  PipMeUp
  • Joined Aug 2011 | Status: Member | 1,305 Posts
It seems that I'm not really good at explaining what I try to achieve...

Here is an excel sheet of a backtest over the last few months of how the watch list evolves. The currencies strength estimator suggests selling the Yen since the 17th but the deduced watch list often changes the way of doing it by alternatively buying CHF/J, E/J, N/J, A/J. Too bad it changes so often.
Attached File
File Type: xlsx backtest.xlsx   69 KB | 328 downloads
No greed. No fear. Just maths.
 
 
  • Post #25
  • Quote
  • Sep 24, 2013 2:50am Sep 24, 2013 2:50am
  •  FXEZ
  • Joined Jan 2007 | Status: developing... | 970 Posts
Your explanation makes sense. I was thinking in more general terms rather than with the specific method you describe in mind. I think at some point many of us put together a currency strength grid and attempt to see if it is possible to identify and trade the strongest against the weakest in a pair, similar to your description. I didn't try Kalman with this idea, however.

The individual currencies are high variance data series, just as individual currency pairs are high variance data series. The frequent switching of rank (the Excel file) I think is a result of this high variance environment. Smoothing the data series introduces lag and one of the keys (as with pairs) is in trend continuation, so lag reduces profit potential, but time series jitter is essentially whipsaw material. Currency analysis shows some interesting things. After studying some charts it appears that some currencies more together in groups and others are sort of opposite groups. It seems to me that among the majors, the 3 groups (from memory) are (roughly) the European currencies (3), the "down under" currencies (2), and the dollar/yen (2). But this (logical) grouping is not strictly true because on any given timeframe you will see diverse relationships. I'm not exactly sure where CAD fits in this picture as it doesn't seem to naturally match up very well with any of the groups.

And you are right, changing time frames changes the entire perspective with regards to currency strength. I just went through several timeframes and none of them look very similar.
 
 
  • Post #26
  • Quote
  • Sep 24, 2013 5:38am Sep 24, 2013 5:38am
  •  PipMeUp
  • Joined Aug 2011 | Status: Member | 1,305 Posts
I stopped fighting the lag too hard. The less lag, the less information. Heisenberg's principle.
No greed. No fear. Just maths.
 
 
  • Post #27
  • Quote
  • Sep 29, 2013 12:21am Sep 29, 2013 12:21am
  •  FXEZ
  • Joined Jan 2007 | Status: developing... | 970 Posts
Quoting PipMeUp
Disliked
I stopped fighting the lag too hard. The less lag, the less information. Heisenberg's principle.
Ignored
I'm not sure how the Uncertainty principle applies to lag, but consider this. If you test the mutual information of data with various lags, you might find, as I have that lower lag data tends to contain more information about the current price than higher lag data. In most of the random walk models, the current price is a key component used to predict the next price. The current price also contains more mutual information regarding the unseen future price than prices with higher lags. Of course, this doesn't mean that lower lag data is superior for a given application. In many cases, smoothing the data helps in averaging out random fluctuations and smooths the decision making process (less whipsaws).

By the way, after revisiting individual currency analysis I've seen some interesting relationships, so thanks for bringing up this topic.
 
 
  • Post #28
  • Quote
  • Sep 29, 2013 4:24am Sep 29, 2013 4:24am
  •  PipMeUp
  • Joined Aug 2011 | Status: Member | 1,305 Posts
Quote
Disliked
...that lower lag data tends to contain more information
A random walk is a Xn+1 = Xn + (white noise). E[Xn+1 - Xn] = E[(white noise)] = 0. Where E[.] denotes the expectancy.

The best estimator of the next price is the current price. This brings no information (Shannon's entropy): you need 0 bits to represent "always the same as the previous". White noise has infinite information. So of course the smaller the lag the more (bits of) information since you quantify the noise.

What I meant was that a local estimator cannot make the difference between a local extrema and a global one. A extremely short term estimator cannot not make the difference between a local extrema and a quick variation due to the noise.

The Markov property assumption seems to hold in the market. So yes all the information about the price is contained in the last candle/price. But what about the information on the hidden state? (I'm not dreaming at finding the hidden automaton! A millenium of price history would certainly not be enough)

Quote
Disliked
By the way, after revisiting individual currency analysis I've seen some interesting relationships, so thanks for bringing up this topic.
You said too much or not enough!
No greed. No fear. Just maths.
 
 
  • Post #29
  • Quote
  • May 6, 2014 1:54am May 6, 2014 1:54am
  •  coolsnake
  • | Joined Dec 2009 | Status: Member | 12 Posts
Any update?
 
 
  • Post #30
  • Quote
  • May 26, 2015 11:04am May 26, 2015 11:04am
  •  goldtime
  • Joined Apr 2015 | Status: Member | 213 Posts
Quoting PipMeUp
Disliked
If I trade two pairs which are 100% correlated I double the risk. Therefore, if I want to trade both, I have to halve the bet size. If I trade two pairs which are 0% correlated (and supposed independent), the outcome only depends on my system and I can bet the full size for both. If I trade two pairs with a correlation somewhere between these two extremes I can linearize between 50% and 100% of the bet size. How does it generalize to three pairs or more?
Ignored

hi PipMeUps, thanks a lot for the links, very complicated subjects.
i think your thread about correlation is much better and useful.
i will study all about yours, please be patient with my stupid questions later on.
thanks
 
 
  • Post #31
  • Quote
  • Sep 14, 2018 8:37am Sep 14, 2018 8:37am
  •  voketexpert
  • | Additional Username | Joined Aug 2018 | 549 Posts
Quoting PipMeUp
Disliked
If I trade two pairs with a correlation somewhere between these two extremes I can linearize between 50% and 100% of the bet size.
Ignored
Hi PipMeUP
im little bit lose in that 3rd statement.
Profit growth tells you the trader ability.
 
 
  • Post #32
  • Quote
  • Sep 14, 2018 11:12am Sep 14, 2018 11:12am
  •  PipMeUp
  • Joined Aug 2011 | Status: Member | 1,305 Posts
Better with a picture?
Attached Image
No greed. No fear. Just maths.
 
 
  • Post #33
  • Quote
  • Last Post: Sep 14, 2018 11:26am Sep 14, 2018 11:26am
  •  Olamide
  • | Joined Sep 2018 | Status: Junior Member | 1 Post
Quoting Vitez
Disliked
PipMeUp great thread I just wanted to create the same topic To keep it simple what usually happens is EUR GBP and AUD would go down while JPY CHF and CAD would go up. This actually happened a few weeks ago. So if we trade with the trend we would go short EUR GBP AUD and long JPY CHF CAD. So we would have nice 6 positions but really we would only have 1 huge position! So would it make sense to trade 1 pair only??
Ignored
And what is that one pair that will have huge position?
 
 
  • Trading Discussion
  • /
  • Pairs correlation and Money Management
  • Reply to Thread
    • 1 Page 2
    • 1 Page 2
0 traders viewing now
Top of Page
Forex Factory Blog Updated: Alerting All Members
  • Facebook
  • Twitter
About FF
  • Mission
  • Products
  • User Guide
  • Media Kit
  • Blog
  • Contact
FF Products
  • Forums
  • Trades
  • Calendar
  • News
  • Market
  • Brokers
  • Trade Explorer
FF Website
  • Homepage
  • Search
  • Members
  • Report a Bug
Follow FF
  • Facebook
  • Twitter

FF Sister Sites:

  • Metals Mine
  • Energy EXCH
  • Crypto Craft

Forex Factory® is a brand of Fair Economy, Inc.

Terms of Service / ©2022