If I trade two pairs which are 100% correlated I double the risk. Therefore, if I want to trade both, I have to halve the bet size.
If I trade two pairs which are 0% correlated (and supposed independent), the outcome only depends on my system and I can bet the full size for both.
If I trade two pairs with a correlation somewhere between these two extremes I can linearize between 50% and 100% of the bet size.
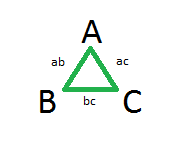
How does it generalize to three pairs or more?
If I trade two pairs which are 0% correlated (and supposed independent), the outcome only depends on my system and I can bet the full size for both.
If I trade two pairs with a correlation somewhere between these two extremes I can linearize between 50% and 100% of the bet size.
How does it generalize to three pairs or more?
No greed. No fear. Just maths.