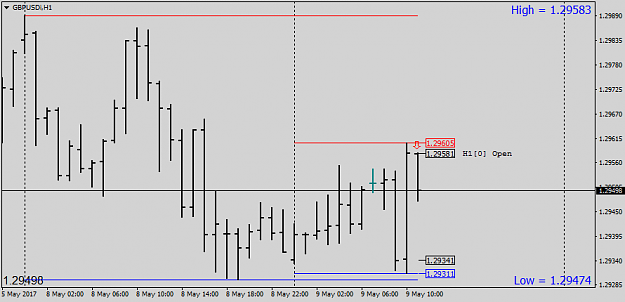
GJ is showing the same look...
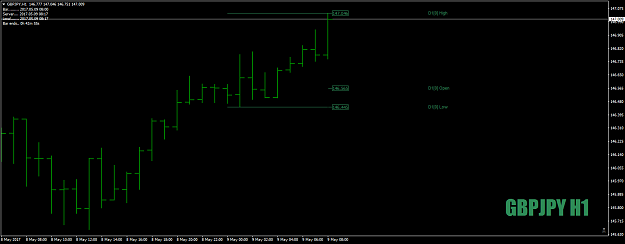
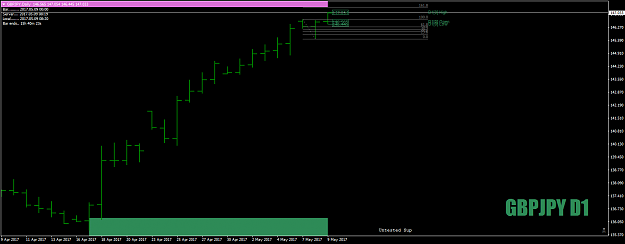
However, perhaps the Daily is most helpful here...
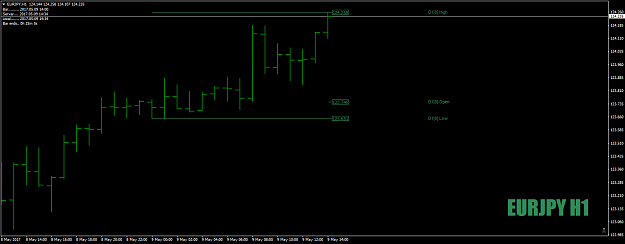
Attached Image (click to enlarge)
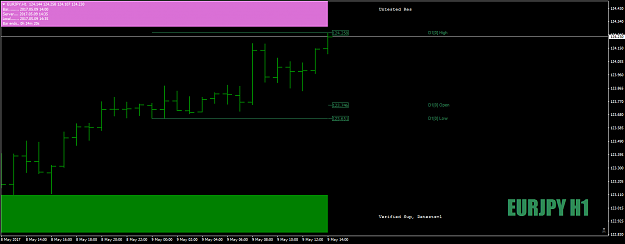
Attached Image (click to enlarge)
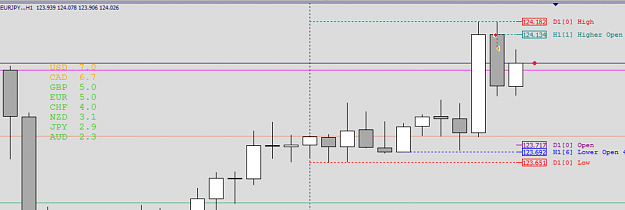
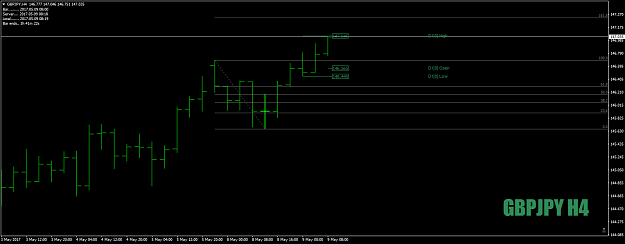
However, perhaps the Daily is most helpful here...
Attached Image (click to enlarge)