Disliked{quote} Good stuff jcat. Really glad it's working for you. Please feel free to share some of your trades with an explanation.Ignored
I don't do anything special, I used your system. I did add a stochastic, and used it for divergence. However, I am seeing the same divergence on the RSI 3, so it may be that I can take off the Stochs.
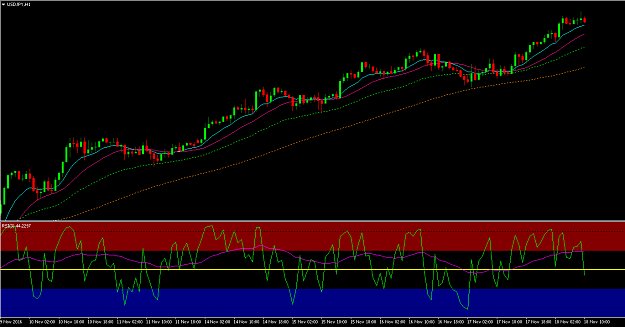
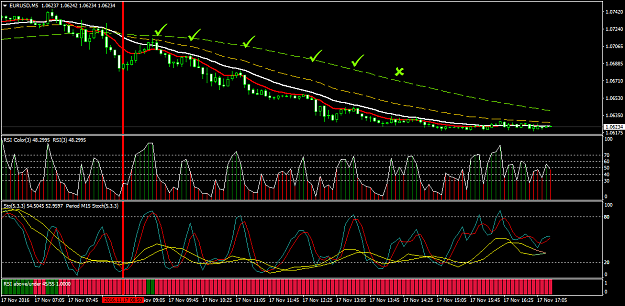
This is the E/U chart. I did not take all of these trades, but I did take 3 of them. The RSI 3 going back below 50 (turns red on my chart) is a great place to get in. I enter 1 pip below that candle. All of the "checks" I put on my chart would have been good trades 10+ pips. The green X, would have gone positive, also, but my 1 pip below the last candle entry, wouldn't have let me take it, AND you can see the RSI 3 turns back to green. (again the trade goes positive pips).
The other indicator I added is the RSI color bar at the bottom. That is my RSI 14. Very clear whether it is over 50 or below. It says "45 and 55" but it is adjustable.
Attached Image (click to enlarge)
Attached File(s)