Hello forum, I've hit this roadblock before and so here I am to see how others approach this. Hopefully this can help other traders as well.
Lets say you're a swing trader intent on entering trades that might last anywhere between a few days to a few weeks or longer and you want to focus on trading the big movements that move in the direction of the "current trend" with clear "structure".
To accomplish this end, you're only willing to enter when you've determined that the structure (eg: higher highs, high lows / lower highs, lower lows) and the "trend" agree with your directional bias.
Except here's the problem, the trend today is different than yesterday's - which is different from last week's trend. And last week's trend might be a pullback on a monthly trend, that might just be a continuation of this past year's trend... which is just a pullback of a longer term 2+ year trend. Same goes for structure: the higher highs and higher lows this week might just be a retracement waiting to continue south.
And this is if you're considering just one time frame. It gets a whole lot more complicated because the 4H, daily, weekly, and monthly candles can and will show different structure and trends from one another even when looking at the same period of time.
So your definition of a trend and your reasoning to trade in its direction on any given pair is extremely likely to differ from another person looking at the same exact price action. You'll be longing a currency someone else is shorting while both having full confidence they are on the side of "the trend".
Do you see where I'm coming from?
I guess what I'm looking for is a way to clarify these concepts in my mind and then have a set of rules that help maximize the probability of being on the correct side of a trend that'll last longer than a few days by standardizing a certain time frame + period of time to consider when deciding on directional bias and then back-testing those rules to see if they're most effective.
This is far easier said than done however, and I can't help but feel I'm over-complicating things a bit.
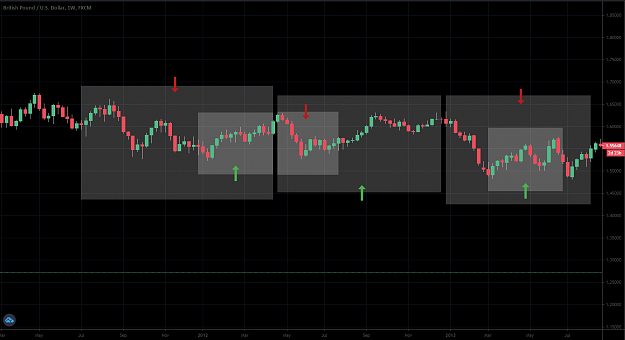
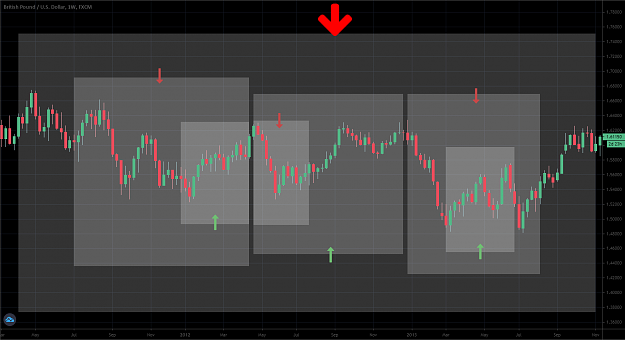
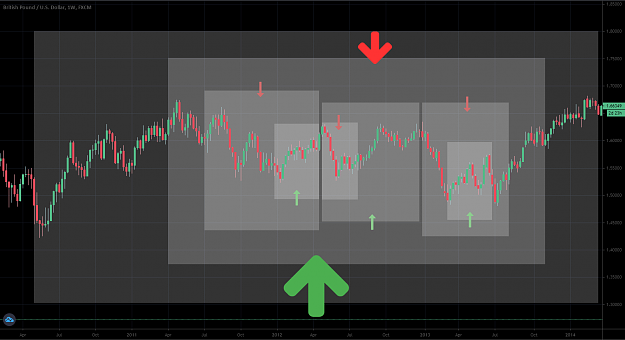
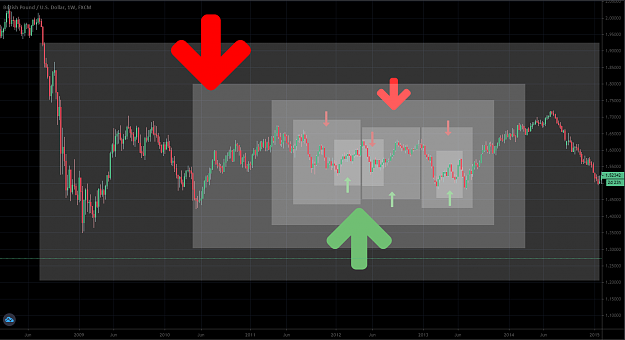
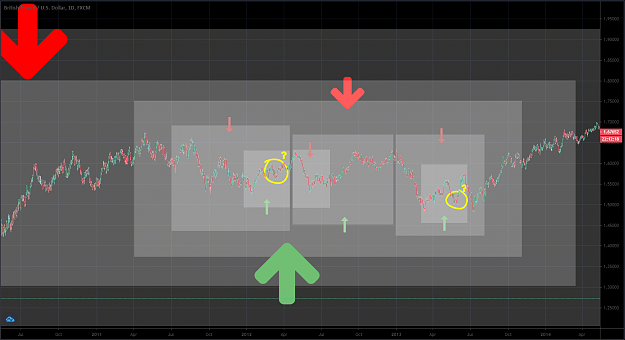
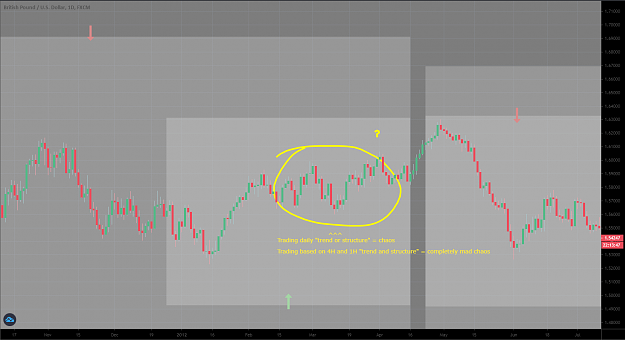
I uploaded some pictures below to help illustrate what I mean.
These are on the weekly / daily time frame - the 4H and 1H charts would've proved my point even further but I could not pull them up. The arrows are meant to show the bias one might have if only considering that length of time on the chart.
So one trader might feel it's a good time jump on a bull trend while another trader looking at a slightly larger sample of time is eager to sell in the direction of a larger trend, and so on and so forth.
Lets say you're a swing trader intent on entering trades that might last anywhere between a few days to a few weeks or longer and you want to focus on trading the big movements that move in the direction of the "current trend" with clear "structure".
To accomplish this end, you're only willing to enter when you've determined that the structure (eg: higher highs, high lows / lower highs, lower lows) and the "trend" agree with your directional bias.
Except here's the problem, the trend today is different than yesterday's - which is different from last week's trend. And last week's trend might be a pullback on a monthly trend, that might just be a continuation of this past year's trend... which is just a pullback of a longer term 2+ year trend. Same goes for structure: the higher highs and higher lows this week might just be a retracement waiting to continue south.
And this is if you're considering just one time frame. It gets a whole lot more complicated because the 4H, daily, weekly, and monthly candles can and will show different structure and trends from one another even when looking at the same period of time.
So your definition of a trend and your reasoning to trade in its direction on any given pair is extremely likely to differ from another person looking at the same exact price action. You'll be longing a currency someone else is shorting while both having full confidence they are on the side of "the trend".
Do you see where I'm coming from?
I guess what I'm looking for is a way to clarify these concepts in my mind and then have a set of rules that help maximize the probability of being on the correct side of a trend that'll last longer than a few days by standardizing a certain time frame + period of time to consider when deciding on directional bias and then back-testing those rules to see if they're most effective.
This is far easier said than done however, and I can't help but feel I'm over-complicating things a bit.
I uploaded some pictures below to help illustrate what I mean.
These are on the weekly / daily time frame - the 4H and 1H charts would've proved my point even further but I could not pull them up. The arrows are meant to show the bias one might have if only considering that length of time on the chart.
So one trader might feel it's a good time jump on a bull trend while another trader looking at a slightly larger sample of time is eager to sell in the direction of a larger trend, and so on and so forth.
Attached Image (click to enlarge)
Attached Image (click to enlarge)
Attached Image (click to enlarge)
Attached Image (click to enlarge)
Attached Image (click to enlarge)
Attached Image (click to enlarge)