I want to use this post to sum up everything that I got so far and I hope Dennis will point out what I got wrong and what is correct.
So we have X key elements: Initial Balance (IB), Central Pivot Range (CPR) and Pivot Points (PP).
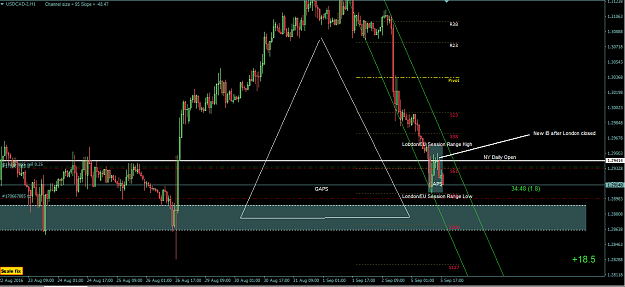
IB - the width of the range is an indicator of the type of trading day ahead; can also be used to range breakout trading if its a narrow range
CPR - relationship between two-day CPR is an indicator of the market's direction for the current day. One also has to take into account the position of the opening candle with regard to yesterday's and today's CPR. Alternatively, Value Range can be used instead of CPR.
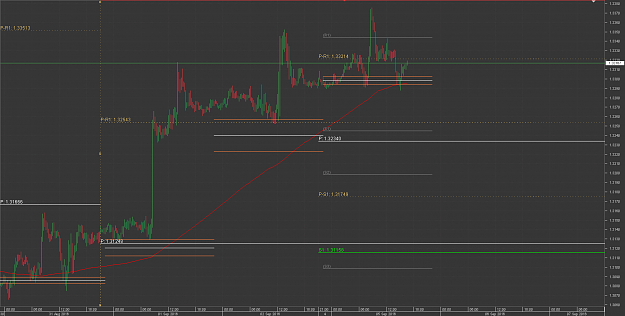
PP - support and resistance lines are great entry points as they usually reflect areas where other traders have placed their stops. Pivot filtering: in bullish setups use S1, R1 and R2, while in bearish setups use R1, S1 and S2.
-----------------
One question, though. Gap & Fade movement - should be used with just one of the three key elements or can be safely applied to all of them?
So we have X key elements: Initial Balance (IB), Central Pivot Range (CPR) and Pivot Points (PP).
IB - the width of the range is an indicator of the type of trading day ahead; can also be used to range breakout trading if its a narrow range
CPR - relationship between two-day CPR is an indicator of the market's direction for the current day. One also has to take into account the position of the opening candle with regard to yesterday's and today's CPR. Alternatively, Value Range can be used instead of CPR.
PP - support and resistance lines are great entry points as they usually reflect areas where other traders have placed their stops. Pivot filtering: in bullish setups use S1, R1 and R2, while in bearish setups use R1, S1 and S2.
-----------------
One question, though. Gap & Fade movement - should be used with just one of the three key elements or can be safely applied to all of them?