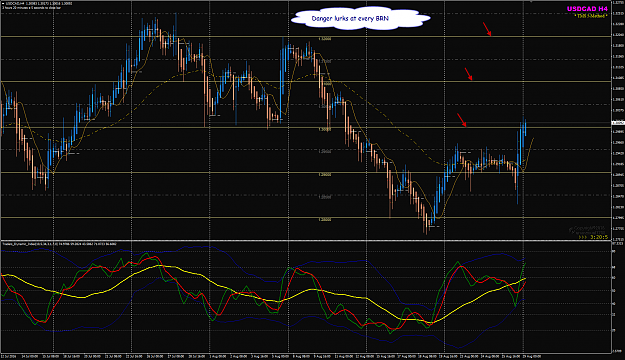
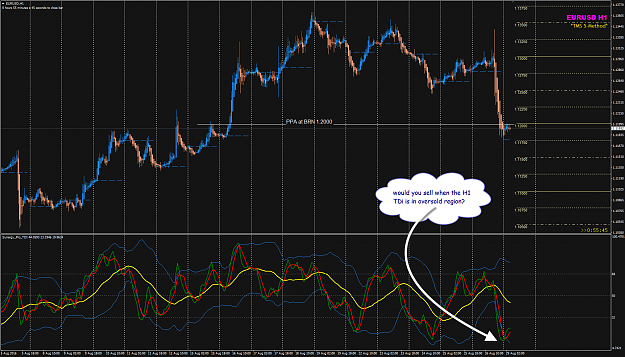
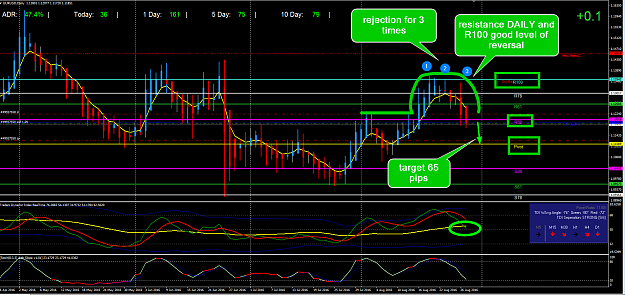
Dislikedhere to answer a few PMs, - what is PPA? - how to identify PPA? PPA=Previous Price Action. .. already mention in previous post. one of the PPA I look for is: - look for price trends and when it ended either in consolidation or reversal, - a trend is when the APB reverses and change colour and continues above or below the 5EMA, Typical Price, Shift+3 (this is basic TMS), - the trend must run for 3 to 8 APB candles of same colour ( one of TMS trader belief) - look at big candles and small candle, then the trend after big and small candles. Example...Ignored
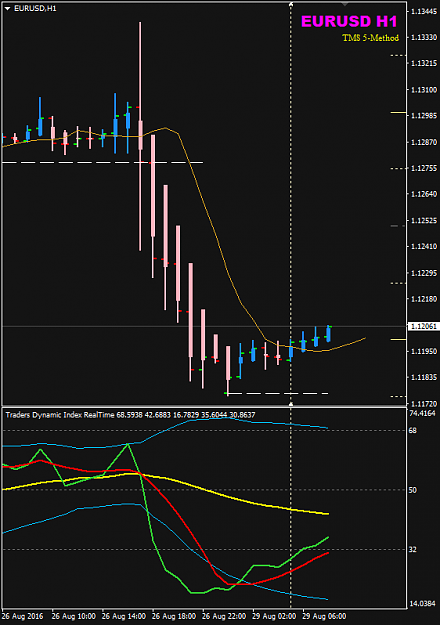
I note you mentioned 3 bar setup here, which I believe it is PCRF. I searched all history of this thread, and found several charts to explain what PCRF is. However, the definition is quite vague. Use bearish turning to bullish as example.
- Some said it is formed of 3 bars, some said it is 4 bars.
- Some said bar2 must make LL, others not
- Some said bar2 should be a hammer, others not
- Some said bar3 or 4 should be HH than bar 2, some said should be HH than bar 1&2, and some said the close of bar 3 should be higher than the high of bar 1&2
...
Could you see if there is a clear definition? Or just share yours?
muyir
Trade your belief, trade like Emmanuel