hi orestebufalo thanks for posting. Where can i get the nice adr indicator you have across the top and also the nice tdi angle panel you have in the tdi window? Thanks
Ignored
in the folder you find the indicators and the screen with adr customizzazion
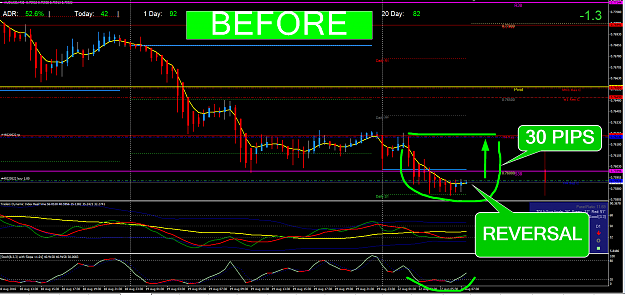
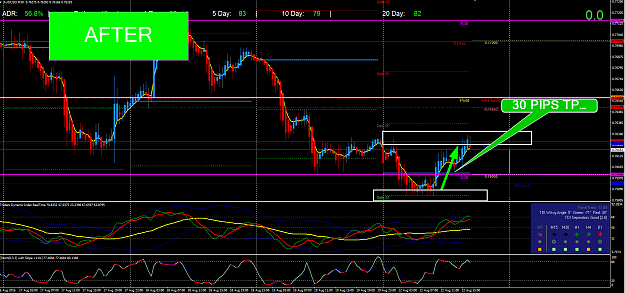
{quote} Good trade! I did similar trade with PASR. H1 setup was a Inside Bar breakout at previous support. +28pips and now remaining trade protect as BE as there is a H4 setup 2 hours ago. {image} H4 setup 2 hours ago; {image}
Ignored
THANK YOU FOR ALL TEACHER. I HAVE STUDIED A LOT ABOUT THIS GROUP. UNFORTUNATELY I HAVE THE PROBLEM THAT I AM ITALIAN AND I DO NOT UNDERSTAND THAT MANY THINGS WRITTEN
{quote} Hi emm, Did Friday's IB qualify as a "small candle"? Or do you wait a bit longer to trail behind 2-day low? Best,
Ignored
Hi tibovwh,
Yes, I treat the Friday Aug 19 Day IB as small candle.
Trailing behind the previous 2 days low after Friday's close would mean we move our stops to 5 pips below Thursday' Aug 18 Day Low.
Yesterday was 'stop hunt' as you can see how the market gap down when NY open on Sunday and the price move down quickly during the Sydney-Tokyo sessions and consolidates at Tokyo lunch time.
Today Aug 23 is buy....
regards,
Honesty is a very expensive gift. You wont find it in cheap people.WBuffett
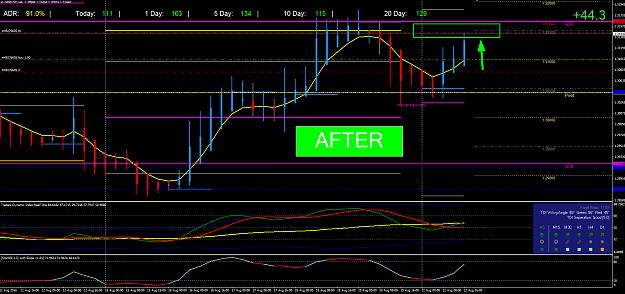
{quote} Thanks Emm...I read that post many times before. And, I always ended up with the attached that is, without the last column "TMS Monitor Recommendation" With Civitas advice, I activated the "Allow automated trading" settings. Still the same old static chart. {image}
Ignored
Hi,
I think you did not setup the expert advisor EA correctly because what you see on your chart are old data objects from the template. If your EA is running , the objects will be refreshed and updated to show its current status.
{quote} THANK YOU FOR ALL TEACHER. I HAVE STUDIED A LOT ABOUT THIS GROUP. UNFORTUNATELY I HAVE THE PROBLEM THAT I AM ITALIAN AND I DO NOT UNDERSTAND THAT MANY THINGS WRITTEN
Ignored
Hi,
You are trading well as I can see your charts.
Never mind we all have different language proficiency, our trading charts are our common language. We post our charts, we can all see what we see the same.
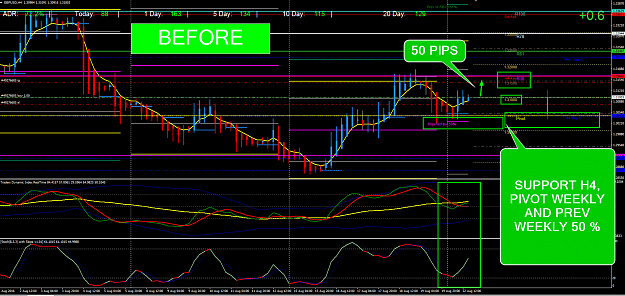
Just take note when you trade the Day chart timeframe and use the Weekly Pivots. The calculated pivots S and R levels are do not show the volatility of the Day timeframe hence your targets can be too conservative when you trade the Day chart.
The weekly pivot is best when we trade the H4 swing and use the pivot S&R and look for CONFLEUNCE with recent swing highs, swing lows and also the BRNs and RNs.
regards,
Honesty is a very expensive gift. You wont find it in cheap people.WBuffett
Hey guys can anyone be so kind and explain me the synergy_apb indicator? It seems to replace my candles and transform them. Searched in the forum couldn't find a good explanation...
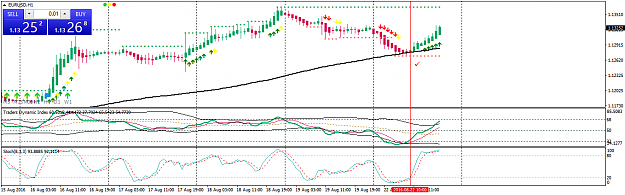
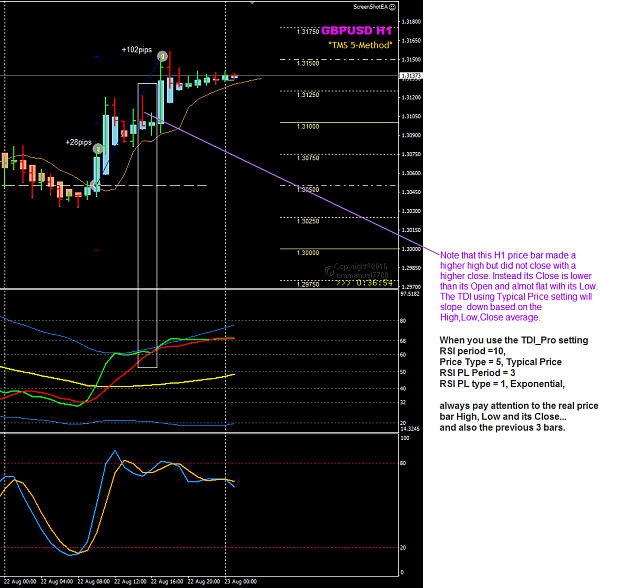
GBPUSD H1 price action with TDI angle: observe carefully this current H1 price bar ' High and Close, this will determine the TDI Green angle. {image} BTW, that last H1 Bullish Outside Bar was good ...
Ignored
That H1 bar did not close with a higher Close but it closed with a much lower Close price which we very near to its Low of that H1 bar.
Pay attention to the real price bar OPen, High, Low and Close and observe the TDI behaviour in repsonse to the High, Low and Close (typical price=5)
The TDI Green PL sloped down....
My trades closed +102pips, 28pips. Average = 65pips.
Attached Image (click to enlarge)
Today is still trade both ways, can buy and sell looking at the H1 price swings. I favour the buy side for Plan A. If Plan A fails, then Plan B is to sell.
Honesty is a very expensive gift. You wont find it in cheap people.WBuffett
{quote} Hi, You are trading well as I can see your charts. Never mind we all have different language proficiency, our trading charts are our common language. We post our charts, we can all see what we see the same. Just take note when you trade the Day chart timeframe and use the Weekly Pivots. The calculated pivots S and R levels are do not show the volatility of the Day timeframe hence your targets can be too conservative when you trade the Day chart. The weekly pivot is best when we trade the H4 swing and use the pivot S&R and look for CONFLEUNCE...
Ignored
thank you for answering friend. My template is set up this way: from m1 to h4: pivot set to weekly. While on the daily pivot indicator is set to monthly. Thank you so much again
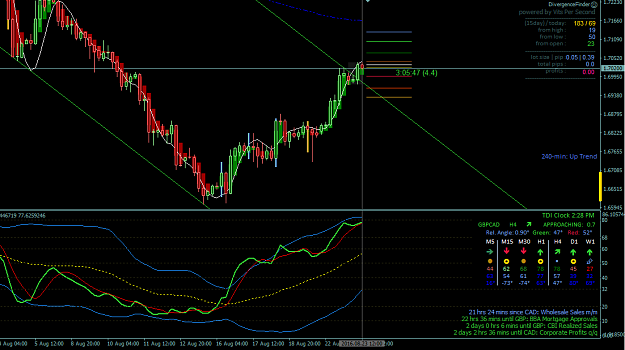
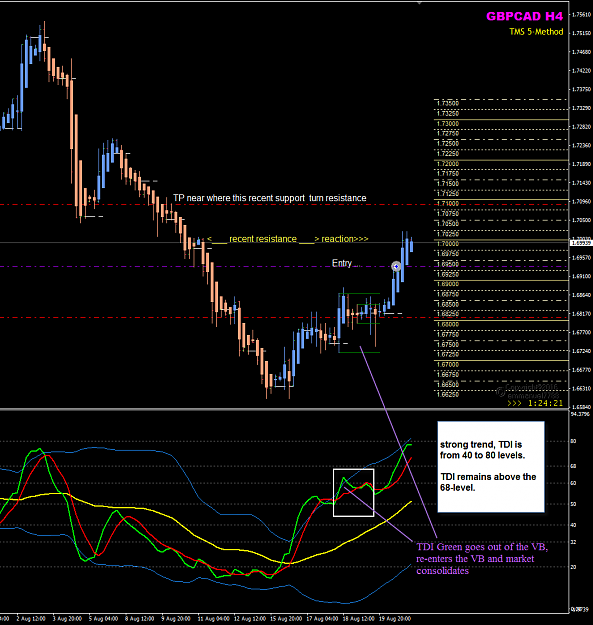
GBPCAD Week 34 Aug 23.
Made this trade entry yesterday and now the price action paused at the recent resistance.
Will wait for the current H4 to close in about 1 hour and decide if I add one more position.
Also consider move my TP to the next higher resistance level 1.7200.
Attached Image (click to enlarge)
Honesty is a very expensive gift. You wont find it in cheap people.WBuffett
GBPCAD Week 34 Aug 23. Made this trade entry yesterday and now the price action paused at the recent resistance. Will wait for the current H4 to close in about 1 hour and decide if I add one more position. Also consider move my TP to the next higher resistance level 1.7200. {image}
Ignored
you are right...
Attached Image (click to enlarge)
Since Frank Sinatra sings in his own way, my chart sing... I did it, my way
{quote} That H1 bar did not close with a higher Close but it closed with a much lower Close price which we very near to its Low of that H1 bar. Pay attention to the real price bar OPen, High, Low and Close and observe the TDI behaviour in repsonse to the High, Low and Close (typical price=5) The TDI Green PL sloped down.... My trades closed +102pips, 28pips. Average = 65pips. {image} Today is still trade both ways, can buy and sell looking at the H1 price swings. I favour the buy side for Plan A. If Plan A fails, then Plan B is to sell.
Ignored
hi, does it mean you occasionally change the TDI settings?
What is your default TDI settings, currently I am using the following: