DislikedIt would be impossible to write in one line the calculation as it uses hundreds of code lines.Ignored
The code I posted should work as a 'wrapper' allowing series of values to be plotted via a MQL4 buffer.
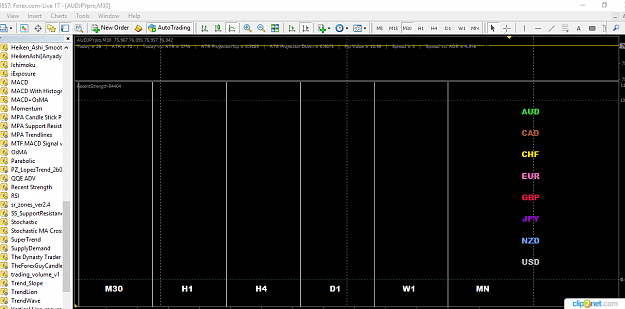
QuoteDislikedI made it start ploting the values as histogram only after it is attached, because it gives me the same value all candles in the past. So it would look like a horizontal line.
I don't know how your strength calc works, hence I can't help you any further. Perhaps you could post your .mq4 source in one of the "I code your indicators for free" threads, and somebody else will help you. Or if you're willing to pay, you could try MQL or elance.