I posted this in another thread but then realized that it might disturb what they were doing, so I removed the post and decided to put this inside its own thread.
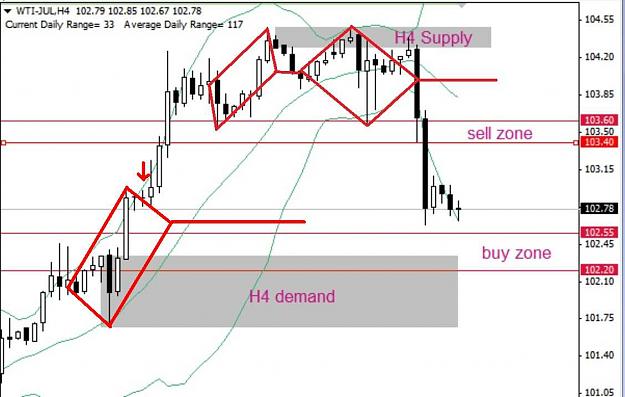
These Oil Charts are interesting indeed. I don't trade Oil, but it does look interesting. I just plucked this chart from earlier in the thread. I might look for some more to play with, but it looks like Oil is nicely responsive to my work:
http://i61.tinypic.com/6xui37.jpg
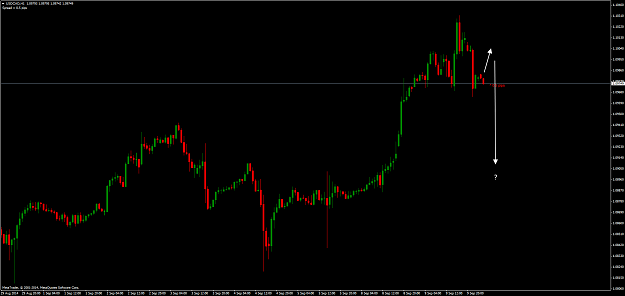
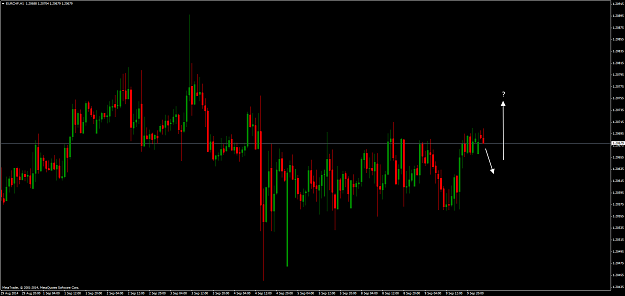
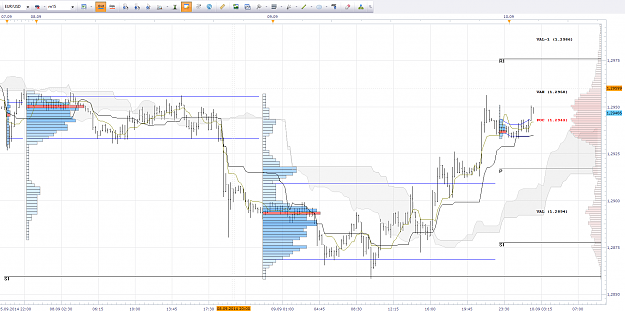
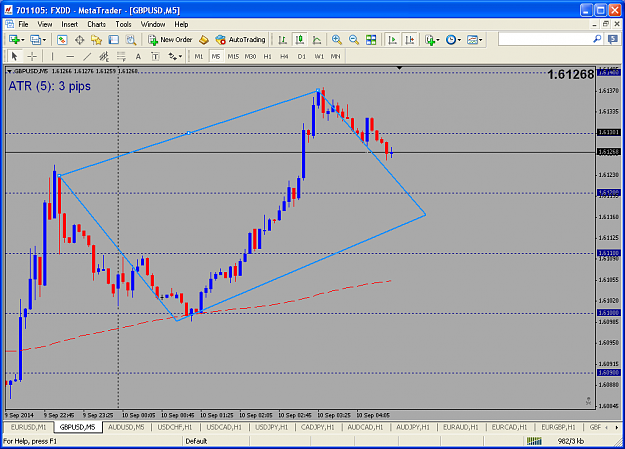
Anybody have an Oil chart they want to throw at me? Or, for that matter, post any chart from any instrument in the world. Make sure it has good volatility. If it already has strong directional bias, then you already know what to do with it. But, if you are CONFUSED about what direction to take it, then post it and I'll try to show you what to do with it.
Make sure I can see the Time Frame and Price Scale of the chart, as well as clearly shown Candles. In fact, you can use Bar Charts, Renko Charts, etc., even a simple Line Chart will do.
http://spotonlists.com/wp-content/up...nce-burton.jpg
How the heck does Lance do it.
These Oil Charts are interesting indeed. I don't trade Oil, but it does look interesting. I just plucked this chart from earlier in the thread. I might look for some more to play with, but it looks like Oil is nicely responsive to my work:
http://i61.tinypic.com/6xui37.jpg
Anybody have an Oil chart they want to throw at me? Or, for that matter, post any chart from any instrument in the world. Make sure it has good volatility. If it already has strong directional bias, then you already know what to do with it. But, if you are CONFUSED about what direction to take it, then post it and I'll try to show you what to do with it.
Make sure I can see the Time Frame and Price Scale of the chart, as well as clearly shown Candles. In fact, you can use Bar Charts, Renko Charts, etc., even a simple Line Chart will do.
http://spotonlists.com/wp-content/up...nce-burton.jpg
How the heck does Lance do it.
F-X-C-M | A Classic Retail Bucket Shop Scam Artist Who Manipulates Prices