New NITRO+ 4TH Upgrade - Sent March 18th 2014 NITRO+ .{image} above ► Multiple GBP Pairs - Loaded on Daily Chart - Fall 2013 below ► Current, Time-Lapsed Pricing as of the 2013.12.4 16:00 Bar Close ..{image} GBPNZD......+106.0 pips...............GBPAUD......+865.0 pips GBPCHF......+310.7 pips...............GBPCAD......+1141.0 pips ...( ( ( ( click preview picture below to view full size animation in a separate tab ) ) ) ) {image}. What happened to EURUSD after the...
Ignored
can u make a video on how to use meter
and how to read the dots i know what they mean but reading it on the meter try to see if it all works with what is going on
Beginning with Beta Build 633 and then in the official 646, Metaquotes has once again changed how graphics are handled. These were glitches from some early beta builds in 2013 that are now back. Like all through the beta process, they fix new glitches without realizing that some other employee probably made some hacks to hotfix earlier glitches.
blackgold22 + abcxabc - will reply to your questions in a few days once 5N+ is complete. It will be completed before Aussie open Sunday GMT.
I apologize 5N+ was not completed earlier as scheduled and noted in above #Post 145. More adjustments were required and some xtra refinements not actually required but done anyways.
The code is wrapped up (unless we get a UAC call from LiveUpdate.exe of course)
Templates are being re-created.
5NITRO+.zip will be available as soon as possible.
5NITRO+ Upgrades were sent just now, May 27th 2014
There is an additional, alternative version 5.02 included in a separate folder. Do Not Install Alternative Future Version 5.02 unless instructed here @FF or on the sites. View the README_Versioning.txt file for more information.
There are an additional 20 Templates included for a total of 55. View the README_Templates.txt file for more information. View the folder 'Templates-Pics' for screenshots of all 55 Templates.
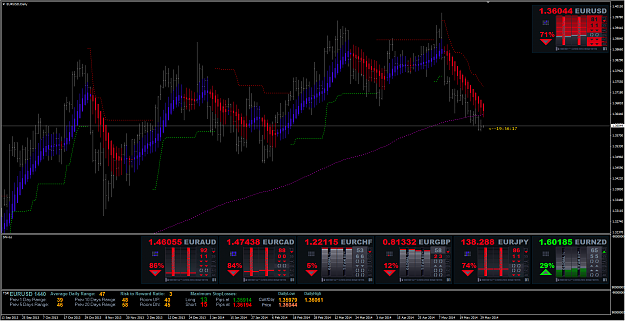
Thanks for the update. What is wrong with this chart? Hint: EUR-NZD {image}
Ignored
@Erebus -
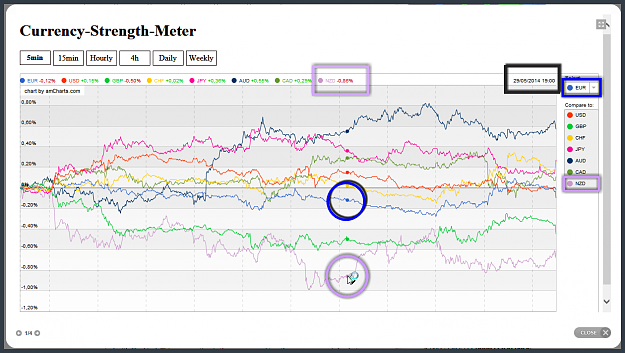
Hint: NZD was the weakest Currency at that time and had been drifting down at a fairly sharp slope for nearly 48 hours prior, and also 10-13 days prior to that. Pull up the Currency Strength Chart for 29/05/2014 19:00 ... NZD was consolidating at its lowest point at the time of your screenshot.
Attached Image (click to enlarge)
The sharp weakness of NZD for nearly 48 hours in comparison to EUR affected the lower time frame data H4 and H1 by a weighted percentage.
The sustained fairly sharp weakness of NZD beginning around May 15th in comparison to EUR affected the current Daily time frame data and also some Weekly by a higher weighted percentage.
So then, in comparison to the 6 other Currencies ... EURNZD should have been anomalous ... and it was ... as your 7 meters show.
5NITRO+ does not just pull data from the current time frame and calculate it. It pulls data from current, higher, and lower ... assigns non-linear weightings to the data from each time frame ... and then aggregates it.
In other words:
current and recent intraday momentum plays a factor in determining the higher time frames like H1, H2, H3, H4, H6, H8, H12, D1, WK, MN.
prevailing trends from the higher time frames play a factor in determining all of the lower time frames like M1, M3, M5, M10, M12, M15, M20, M30, H1
How much of a factor each additional time frame has on the current loaded is broken down on the 5NITRO+ Formula Page. Current formula and info still needs updating. The User can now select how much of a factor these lower and higher time frames have by choosing either:
Time Outlook: extended
Time Outlook: reduced
These options and their effects are explained in the change log on the home page or wherever it may have been moved.
As I said in #Post 151, there is a Text file called README_Versioning.txt in your zip file.
It explains why there is an extra folder with alternative 5NITRO+ and 5NITRO+Lo Indicators. I guess some people do not have Notepad or Wordpad or Word or Google Drive or Evernote to read text files so I'll post it below:
Inserted Code
Versioning Explanation

5NITRO+ 5.00 - No Changes were made to any parts of the formula.

5NITRO+ 5.02 Future Alternative - No Changes were made to any parts of the formula. The calculations and output is identical to 5NITRO+ 5.00. Slight changes were made to graphics in anticipation of upcoming MT4 builds.

It looks like Metaquotes fixed a major glitch introduced in Build 646 with this recent new Build 652 released on May 23rd, 2014.  Dynamic number outputs that had variable width would change their anchor points.  For Example: when output would change from 9 to 10 or from 99 to 100.  Extra code has been added to 5NITRO+ to deal with whatever they ultimately decide on.  If this glitch is ever introduced again, 5N+ will display correctly.

Further refinements were made to graphics.

Re-alignments to some graphics were necessary as Metaquotes made slight 1 pixel adjustments for whatever reason they decide to do so.  These odd changes took place with every other new build for at least 1 year after Metatrader 5 was first released.

5NITRO+ 5.02 Future Alternative - Because of these subtle changes that have happened and will likely continue to happen like in MT5, we provided this Alternative version in anticipation of future changes or changing back.

The Templates provided will work with either 5NITRO+ version, 5.00 and 5.02.

If a new build is released that changes graphics alignment, then delete version 5.00 and install version 5.02.  We will post information on the sites and on ForexFactory letting everyone know if taking time to switch versions is worthwhile.  If the modified version does not provide an adequate fix, we will once again provide new files.  Depending on how soon, you will either receive a new 5NITRO+ Version 5.03 or a new 6NITRO+.

To identify the versions, hover over the Indicator with your mouse as it is displayed in the 'Custom Indicator' list in your Navigator.  The version number is also displayed in the 'About' tab of the Indicator properties.

To identify the versions within their MQL4/Indicators folder:
Version 5.00 was created at 1:00am
Version 5.02 was created later at 5:00am
Metaquotes released Build 654 yesterday afternoon after market close - all is good.
I just got an email this morning that a user is still on Build 625. She has not had any LiveUpdates since March or so, or whenever 625 was released.
All 10+ Brokers we use are all on the current 654 after I rebooted them and allowed the UAC prompt.
Metaquotes has called some of these new builds 'Beta' and others did not have 'Beta' in the title @ MQL4.com. Some other Devs claim all of these recent builds since 625 have been Beta ... leading up to an official release in June or July. I will find out for sure on Monday.
Many of the graphical adjustments made for 5NITRO+ Version 5.00 were finalized based on Build 652, which was the current build at the time last week. Except for the fix made to variable GLOBAL% and T3 width like 100% and 100. Extra code was added to deal with anything Metaquotes changes.
So, if your Broker still has you on a Build less than (but not equal to) 646 and your graphics appear misaligned, you may need to replace Version 5.00 with Version 5.02 if it is bothersome. Confirm correct alignment by viewing the screenshots included in your folder 'Templates - Pics'.
Like is mentioned, you do not need to change any of your Templates. All of your Templates will call '5NITRO+' or 5NITRO+Lo' and disregard the Version number.
If this makes any sense:
the graphics in Alternative Version 5.02 were positioned based essentially on Builds prior to 646. The speculation was, based on experience with MT5 during its first year and experience during this whole Beta process beginning last year, that the weird adjustments made by Metaquotes for Builds >=646 ... might eventually be changed back. That the changes may not have been intentional, but instead the result of fixing some other non related glitches. This was the case recently when the 'dynamic, variable output width' glitch was introduced, probably by mistake, in Build 646. And then quickly fixed in Build 652 one week later.
So, Version 5.02 applies to old builds and possibly new ... but not in between Builds 646, 650, 652, or 654. I just had no idea that some users were still using 625 and have not been getting scheduled LiveUpdates like everyone else, and therefore intended Version 5.02 to only apply to possible future builds ... not very old builds.
So this is good. Now everyone has a correctly displaying version regardless of current Build ... at least for now.
So i have skimmed the thread, and the website... I don't get it, what is the point. Is it another indicator, or it is a piece of software that does probability calculations for you based on your inputs?
So i have skimmed the thread, and the website... I don't get it, what is the point. Is it another indicator, or it is a piece of software that does probability calculations for you based on your inputs?
Ignored
@MCRotter -
Yes, it is an Indicator. An Indicator that compiles nearly all of the Indicators supplied with your platform along with support & resistance across up to 7 variably-weighted adjacent time frames in total, dependent on which time frame it is loaded on or which time frame you have entered. It then aggregates these ~145 parameters into a percentage. The percentage represents how many of those ~145 parameters are indicating the same trend bias. There are 100 percentage points Long, 100 percentage points Short. For Example: GLOBAL 50% Long represents that 75% of all parameters of the entire meter are indicating Long bias.
In general, the matriXx dots trigger less on lesser time frames because the probability that current price action is overbought or oversold .... is less.
The indistinction of market noise vs. normal volatility plays a role. Market noise + low volume sessions as a percenatge of data plays a role.
{quote} @MCRotter - Yes, it is an Indicator. An Indicator that compiles nearly all of the Indicators supplied with your platform along with support & resistance across up to 7 variably-weighted adjacent time frames in total, dependent on which time frame it is loaded on or which time frame you have entered. It then aggregates these ~145 parameters into a percentage. The percentage represents how many of those ~145 parameters are indicating the same trend bias. There are 100 percentage points Long, 100 percentage points Short. For Example: GLOBAL...