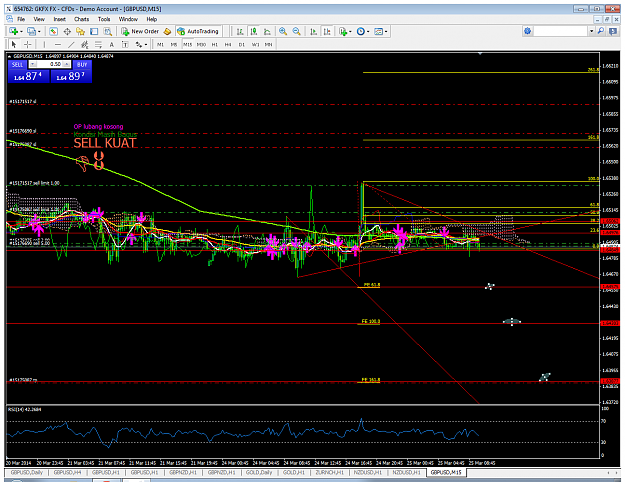
Finally we find the price under the daily kumo after the last time July last year, after spike to 1.5535 area, H4 closed under 1.5500 so, it is a good sign for long tearm bear...new rules will be started. 1.552x will be strong resistance area for bullish action.
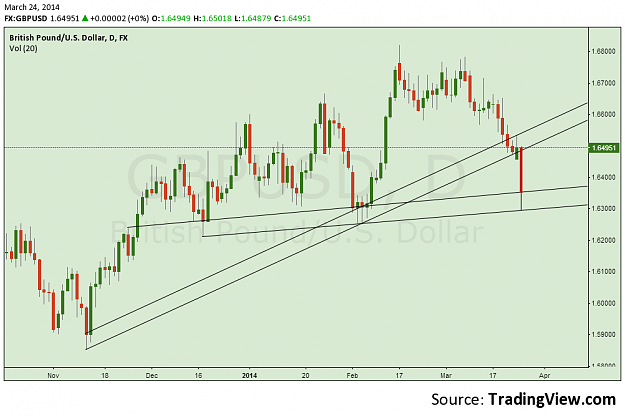
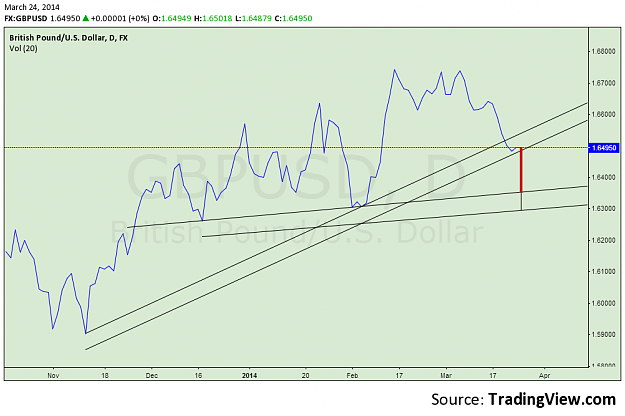
BUT, based on weekly chart i see the possibility for cable to climbing again to create a pullback or even continuing the bullish trend.
I don't trade weekly chart better to see the PA around this area, ......
Just plot ichimoku indicator and you will get the picture of possibility of price movement in various time frame...