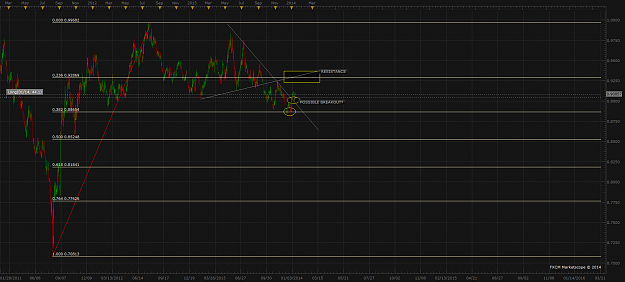
DislikedI know monthly charts are just too big for most of us , but it is a good way to see pure trend direction in bigger timeframes , and when we look at the monthly chart on USDCHF we can see a nice Head and Shoulders pattern with the bearish formations .. {image} On the other side I used circles in order to understand the structure of the bearish trend which started almost 12 years ago , and what I can see now is a significant circular support is broken and the price is sinking down to form a circular double bottom. Here are the screenshots for it......Ignored
Swissy moves in sink with the Euro
800 is 1k pips down means 1.46 Euro
Not a good probability scenario.
Regards
In trading, you have to be defensive and aggressive at the same time