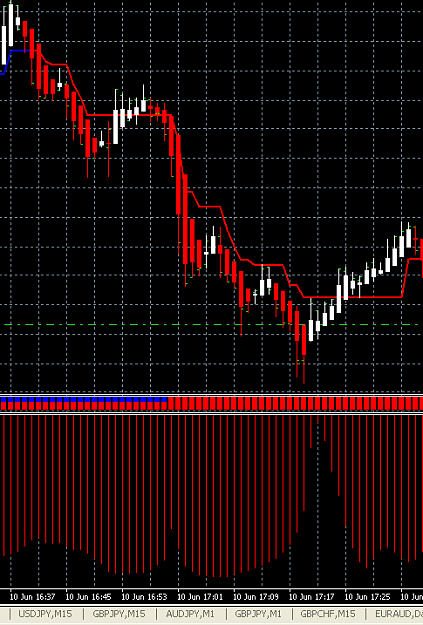
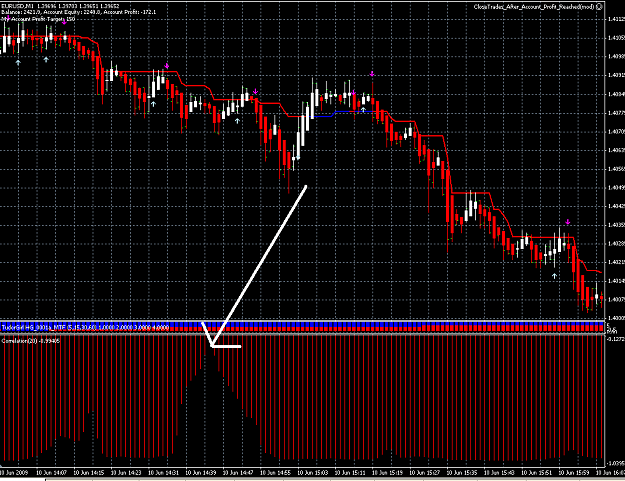
Place this indicator on a 1 min eur/usd chart.
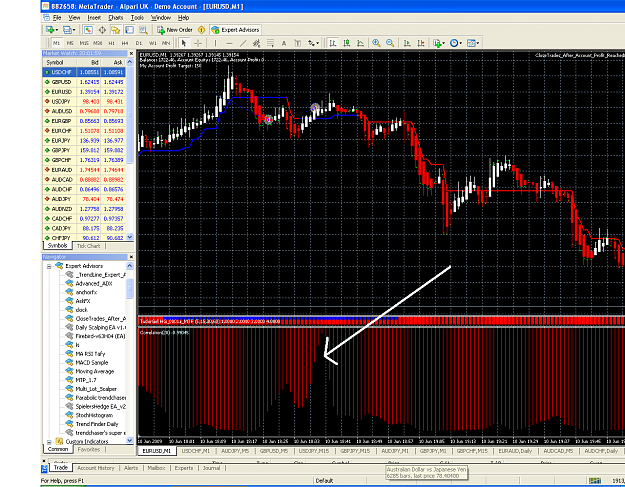
It seems that when correlation readings dip for a few bars, that big movements later follow on eur/usd. The indicator measures correlation with usd/chf.
I started noticing this kind of by mistake looking at another system
Is anyone else seeing this? Maybe this is actually showing when big money USD traders are positioning themselves??
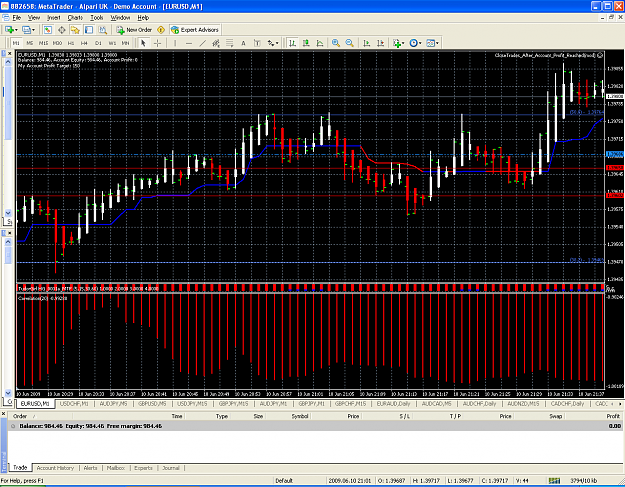
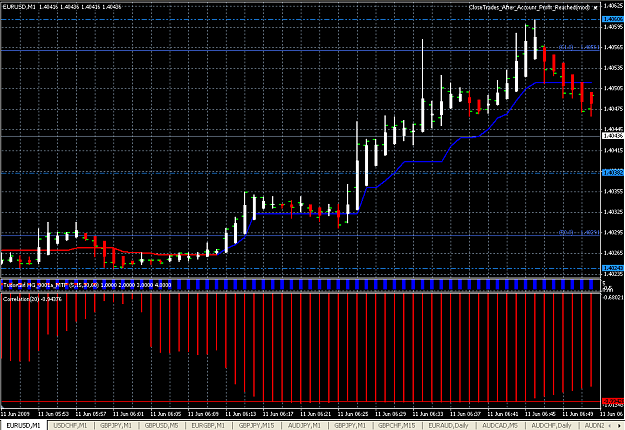
Attached Image (click to enlarge)
Attached File(s)