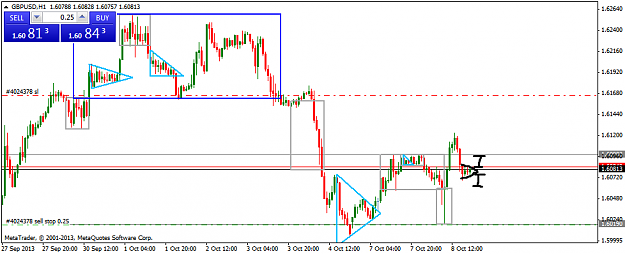
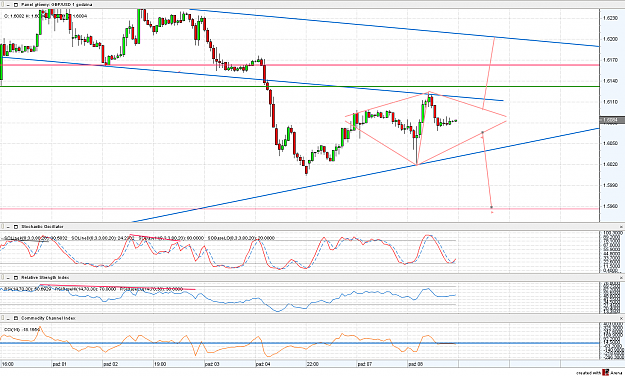
Disliked{quote} Not at all, you've just got to see where support and resistance comes in, watch how the candles behave and go for it. This hour chart shows that this morning's sharp down spike was held at the 76.4% fib level, to then rally strongly up to the first obvious resistance level on the hourly chart, which was a R1, MA200E/100S, which together formed a very powerful resistance area off of which traders would have cashed in their profits thereby sending cable down again to the main daily pivot level. At the moment I'm looking for a bearish day tomorrow,...Ignored
 Cable Update (GBPUSD)
- #348,402
- Oct 8, 2013 12:33pm Oct 8, 2013 12:33pm
- Joined Jul 2007 | Status: Short on USD/MXN, Long on legs | 16,578 Posts
New voice message: Why are you calling me? If I need you, I'll call you!
- #348,404
- Oct 8, 2013 12:52pm Oct 8, 2013 12:52pm
- Joined Mar 2006 | Status: Chase that Dollar .. | 1,416 Posts
- #348,412
- Oct 8, 2013 6:39pm Oct 8, 2013 6:39pm
- Joined May 2011 | Status: Get to the Chopper | 17,905 Posts
Come with me if you want to live....
- #348,413
- Oct 8, 2013 6:41pm Oct 8, 2013 6:41pm
- Joined Feb 2011 | Status: building a shortfolio | 2,418 Posts
Twitter: @TrendersGame
- #348,414
- Oct 8, 2013 8:13pm Oct 8, 2013 8:13pm
- Joined Jul 2007 | Status: Short on USD/MXN, Long on legs | 16,578 Posts
New voice message: Why are you calling me? If I need you, I'll call you!
- #348,418
- Oct 8, 2013 9:17pm Oct 8, 2013 9:17pm
- Joined Jan 2011 | Status: dump and pump | 4,055 Posts
All posts are my personal opinion