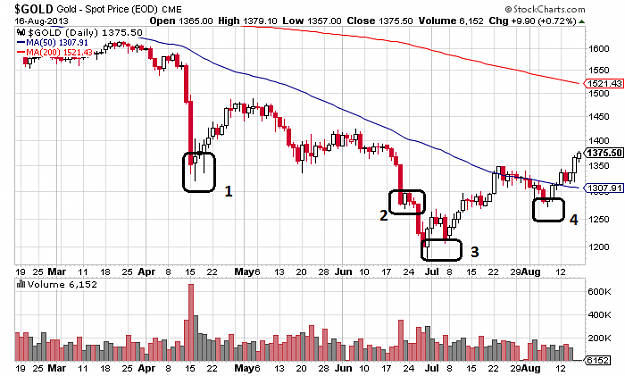
DislikedI am very convinced that Gold has bottomed,,,as long as the following conditions held. 1. Big Vol with wide bar spotted.. Possibly Buyers with deep pockets started to accumulated from panic herds. 2. 2 wave of big vol, with price down, to depress further.. 3. Extreme Shake Out...but ends with bullish engulfing candle.. 4. First support of Higher Low spotted... Keep Staking... Sonic {image}Ignored
Up and down. This is what it has been doing,......while making progress downwards more and more! The bottom and reversal? Or, just the beginning of another pull up, a retrace in the established larger trend down?
Sonic, your chart (pic. 1) does not have the aid of PVSRA, however, did you notice that from the area of #'s 2-3, as the price direction changed and started up, that the volume has been decreasing? Perhaps when the price gets higher, the volume will increase again, but if that happens then it might well turn out to be just another retrace in the down trend.
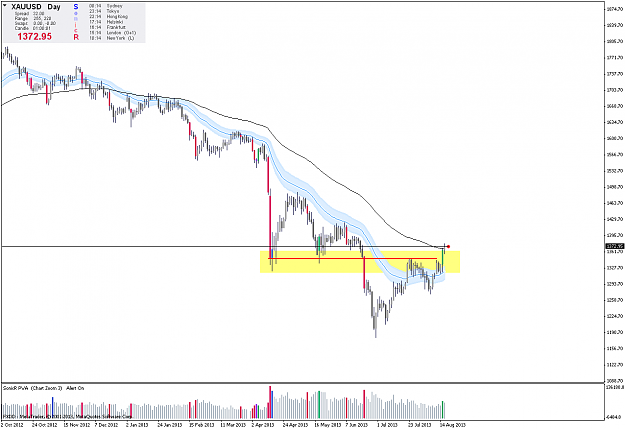
Now, with the aid of PVSRA (pic. 2) we see the big boys push up volume, followed by a spinning top day candle. This could be Pump & Dump time. Also, note that all this culminates in the area of the 89 ma, which is the "traditional" forex market divider between bullish and bearish "market sentiment". Yes, all just a bunch of bull shit, but a lot of traders put stock in that. So, one has to be suspicious that the MMs hiked the price while closing out longs and loading up shorts,....hiked the price up to this "traditional" line in the sand area so that other longs would hold out in the hopes of a breakout upwards, and maybe even add more longs. This is something the bear MMs (if they are bears) would love as a reaction to their pump,....more longs coming in! Just means more liquidity for any bear MMs to continue to close longs and open shorts.
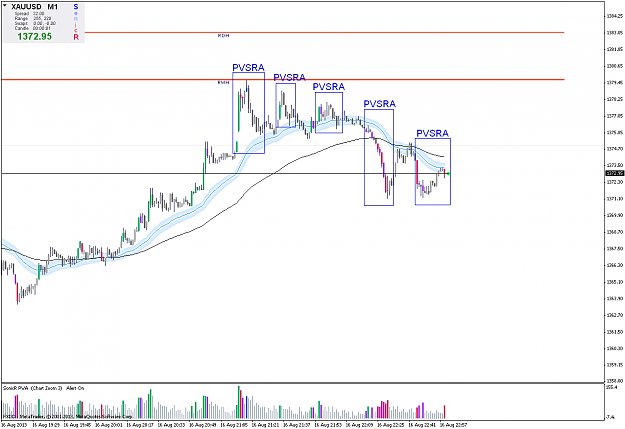
Up or down from here? Who knows? But M1 PVSRA (pic. 3) is indicating the MMs are bears, most recently pushing up price above the 3/4 SR to do their most heavy trading, selling, and then selling more bringing the price down off the highs achieved. Pump & Dump. The secret to using volume in analysis, is to use it on the smaller time frame charts, not the larger ones, not if you want a more accurate picture of what the MMs are doing real-time.
A Bit of Work Presented With Best Wishes That It Helps,
-tah
Attached Image(s) (click to enlarge)