• Home
  • Forums
  • Trades
  • News
  • Calendar
  • Market
  • Brokers
  • Login
  • Join
  • User/Email: Password:
  • 1:22pm
Menu
  • Forums
  • Trades
  • News
  • Calendar
  • Market
  • Brokers
  • Login
  • Join
  • 1:22pm
Sister Sites
  • Metals Mine
  • Energy EXCH
  • Crypto Craft

Options

Bookmark Thread

First Page First Unread Last Page Last Post

Print Thread

Similar Threads

PTZ Based on Volume Spread Analysis and Harmonic Patterns 1,723 replies

ECN && STP && Scalping && Hedging - Broker Review - Oct 2009 24 replies

What does volume tell us about the market? Volume patterns? 18 replies

Harmonic Patterns and Volume 2 replies

Price & Candlestick Patterns with S&R's - Trade Ideas 20 replies

  • Trading Journals
  • /
  • Reply to Thread
  • Subscribe
  • 134
Attachments: Trial Run for Volume&Range Patterns
Exit Attachments
Tags: Trial Run for Volume&Range Patterns
Cancel

Trial Run for Volume&Range Patterns

  • Last Post
  •  
  • 1 67Page 8910 11
  • 1 7Page 89 11
  •  
  • Post #141
  • Quote
  • Aug 6, 2013 5:56pm Aug 6, 2013 5:56pm
  •  Tamzy1
  • | Joined Aug 2006 | Status: Member | 26 Posts
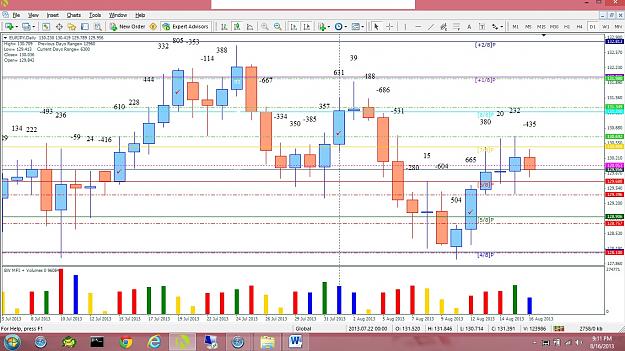
Thanks for the reply, however on some candles which were already completed I still can't get any numbers, I have tried several options, fixed scale and scroll the ceiling of the chart down, minimize the chart, moving the script line back and forth, but on some candles it keeps skipping them, displaying numbers for the candles before and after them. A recent example is the daily candle for yesterday, I can't get it to display the Effi number for yesterday's daily candle.

But anyway that being said i still enjoy your system and am looking forward to learning more about it.
Thanks
 
 
  • Post #142
  • Quote
  • Aug 6, 2013 8:20pm Aug 6, 2013 8:20pm
  •  Ati Baia
  • | Joined Nov 2011 | Status: Member | 1,042 Posts
Shaltay,

Thanks for taking time to reply.

Cheers

Ati


Quoting Shaltay
Disliked
{quote} Hi Ati, This indicator is Market Facilitation Index of Bill Williams combined with volumes. It doesn’t create spikes in the diagram at the opening of a new period and saves place on the chart. It shows exactly what BW said: interest (green)/fake (blue)/fade (brown)/squat (yellow). The colors are just my preferences. If you like it – it is here for download. http://www.forexfactory.com/showthre...30#post6304830 The patterns which I tested in the first half of the thread are based on the combination of my own tools and...
Ignored
Money is important, Love is essential.
 
 
  • Post #143
  • Quote
  • Aug 7, 2013 3:10am Aug 7, 2013 3:10am
  •  Shaltay
  • | Joined Mar 2010 | Status: Member | 209 Posts
Quoting Tamzy1
Disliked
on some candles which were already completed I still can't get any numbers
Ignored
I must thank you twice, Tamzy1, for revealing this bug. If it happens - it needs a solution. Here it is: I attach a small Excel file with the same calculation, put your data in the cells. I did so before the tool was programmed, it takes time, certainly, but will serve as an emergency measure.

Dear traders, for those who doesn't like Excel - there is a free alternative in Gnumeric home office. Ask Google about Gnumeric excel, a lot of its functions are the same.
Attached File(s)
File Type: zip Manual calculation of EFFI numbers.zip   7 KB | 192 downloads
 
 
  • Post #144
  • Quote
  • Aug 7, 2013 6:10am Aug 7, 2013 6:10am
  •  Ati Baia
  • | Joined Nov 2011 | Status: Member | 1,042 Posts
Quoting Shaltay
Disliked
I must thank you twice, Tamzy1, for revealing this bug.
Ignored
any chance of posting the Mt4 source file: .mq4? should not be a problem as you posted the calculation formula anyhow?
Money is important, Love is essential.
 
 
  • Post #145
  • Quote
  • Aug 7, 2013 11:37am Aug 7, 2013 11:37am
  •  Tamzy1
  • | Joined Aug 2006 | Status: Member | 26 Posts
Hi Shaltay

Thanks for the Excel Cal, Ya that will help.
Thanks again
 
 
  • Post #146
  • Quote
  • Aug 7, 2013 11:47am Aug 7, 2013 11:47am
  •  Shaltay
  • | Joined Mar 2010 | Status: Member | 209 Posts
Quoting Ati Baia
Disliked
any chance of posting .mq4?
Ignored
The equation in the Excel file is hidden. Mql4 - only later, sorry. I have my reasons.
 
 
  • Post #147
  • Quote
  • Aug 7, 2013 5:41pm Aug 7, 2013 5:41pm
  •  Ati Baia
  • | Joined Nov 2011 | Status: Member | 1,042 Posts
Shaltay,

Had a thought so I thought I post it. No need to discuss it - just something to stimulate your thinking.

If you involve Volume in your calculation: how do you account for different brokers: did you test it.


  1. Post# 31

Attached Image (click to enlarge)
Click to Enlarge

Name: BrokerTickCounts.png
Size: 127 KB
Money is important, Love is essential.
 
 
  • Post #148
  • Quote
  • Aug 7, 2013 6:12pm Aug 7, 2013 6:12pm
  •  Shaltay
  • | Joined Mar 2010 | Status: Member | 209 Posts
Thanks for the great question, Ati! Yes, I thought about it. In my Alpary tick volumes differ even between demo and live accounts. But so far inside the equation the data errors become insignificant. For example, from the recent hours:

demo volume = 3989, demo EFFI = 861;

live volume = 4769, EFFI = 866.

demo volume 5225, demo EFFI = 779;

live volume = 5803; live volume = 798.

Besides, different brokers create different H4 candles, for example. The picture can also depend on it. Exact numbers are not important. It is the correlation between the numbers that matters for trading decisions.

This aspect was one of the reasons why in the post #111 I invited people to test the method. This why I warned there: what works for me may not work for you. I assume that the equation levels the results received from various data. I assume that efficient candles must give efficient numbers in any situation. I hope to hear some feedback about it one day.
 
 
  • Post #149
  • Quote
  • Aug 8, 2013 8:53am Aug 8, 2013 8:53am
  •  Ati Baia
  • | Joined Nov 2011 | Status: Member | 1,042 Posts
hi Shaltay,

Just played a bit with your script: EFFI Index 5.ex4
something I noticed: a bug.

Attached Image (click to enlarge)
Click to Enlarge

Name: eurusdm1.png
Size: 29 KB


It seems that the script runs in some sort of while loop: so one can drag the HLine around.

but whenever it encounters something like the candle where it plots Text: (this is an error it should plot a number) the script is removed:
Reason in logfile: 09:44:02 EFFI Index 5 EURUSD,M1: zero divide

Probably you know that but you and it might not bother you as long as your account grows.


Maybe something like this is also the reason that some numbers are not plotted as mentioned a few posts above.
Just wanted to give you some feedback.

Cheers

Ati
Money is important, Love is essential.
 
 
  • Post #150
  • Quote
  • Aug 8, 2013 9:06am Aug 8, 2013 9:06am
  •  Shaltay
  • | Joined Mar 2010 | Status: Member | 209 Posts
Thanks, Ati, it is exactly how the script works with a perfect doji - in a zero efficient candle the equation falls in a "zero divide" option which is not possible. I've mentioned about it in the Introduction post in my blog, and I explained it recently in the post #140.
Quote
Disliked
Last, the script dies after a doji, though the line remains on the chart. But in this case it will write the word "text" above that doji.
You may be right in that part, that if the script was caught by a doji, and you didn't notice it - you will not get the numbers unless you throw the script again on the chart. It is easy to check: right click on the chart and see if there is a line "Delete a script". If this line is absent - run the script again.

Many thanks for all your feedback - it will go into the FAQ section
 
 
  • Post #151
  • Quote
  • Aug 8, 2013 9:09am Aug 8, 2013 9:09am
  •  Ati Baia
  • | Joined Nov 2011 | Status: Member | 1,042 Posts
sorry, I did not read all the thread. my fault.

Quoting Shaltay
Disliked
Thanks, Ati, it is exactly how the script works with a perfect doji - in a zero efficient candle the equation falls in a "zero divide" option which is not possible. I've mentioned about it in the Introduction post in my blog, and I explained it recently in the post #140. {quote} You may be right in that part, that if the script was caught by a doji, and you didn't notice it - you will not get the numbers unless you throw the script again on the chart. It is easy to check: right click on the chart and see if there is a line "Delete a script"....
Ignored
Money is important, Love is essential.
 
 
  • Post #152
  • Quote
  • Aug 8, 2013 9:20am Aug 8, 2013 9:20am
  •  Shaltay
  • | Joined Mar 2010 | Status: Member | 209 Posts
Quoting Ati Baia
Disliked
sorry, I did not read all the thread. my fault.
Ignored
Absolutely not. Nobody is obliged to read the laboratory studies, aka a trading journal. My task is to compile a well structured system, and I'm really grateful to the readers that can ask important questions and help me to determine the essential moments.
 
 
  • Post #153
  • Quote
  • Aug 16, 2013 12:50pm Aug 16, 2013 12:50pm
  •  Tamzy1
  • | Joined Aug 2006 | Status: Member | 26 Posts
Hi Shaltay

I know this week hasn't been good, but I still believe in you and your system. Are there any updates for the system yet?

Thanks
 
 
  • Post #154
  • Quote
  • Aug 16, 2013 3:31pm Aug 16, 2013 3:31pm
  •  Shaltay
  • | Joined Mar 2010 | Status: Member | 209 Posts


Hi Tamzy1, the week was not bad, in fact. The trade that ended with a loss has nothing to do with EFFI method, just testing one more idea. The EFFI trade is which is live now (the model of broken reinforcement on H4 chart).


I’m very busy now – with construction works in my country house and with some repairs in the city flat, running to and fro between two places. This week I could check my positions only once, at the end of the day. I stopped the first trade, the reinforcement candle happened exactly at the end of the same day, the second trade was triggered very soon, and I don’t see a reason yet to stop it.


  • Post #155
  • Quote
  • Edited 4:46pm Aug 16, 2013 3:51pm | Edited 4:46pm
  •  DrNoStopLoss
  • | Additional Username | Joined Mar 2013 | 317 Posts
Hi Shaltay,

I am amazed at your wisdom and want to first say thank you for posting on here. I am going to study this thread and your blog this weekend. Please bear with me as I may have many questions at first. I will promise you I will give you everything I have if you can help steer me at first. Many thanks and very excited. And just to let you know I prefer H1 and swings.


At reading your thread, is it possible to post your Murray Lines and Sup/Res lines and any other indicators you are using for this method? I see you have posted the BW MFI indicator on here. Or even a template so I can try to follow your examples. Appreciate everything you are doing, rust me I will not take it for granted. Blessings.

Raymond


  • Post #156
  • Quote
  • Aug 16, 2013 5:34pm Aug 16, 2013 5:34pm
  •  Shaltay
  • | Joined Mar 2010 | Status: Member | 209 Posts
Hi Raymond, you are welcome! And thanks for the kind words. You could start with the Introduction post in the blog and other posts to get some theory. In the thread the discussion of EFFI method goes after the post #111, if I'm not mistaken. No need to read the first half of the thread so far.

I attach Murray and Sup/Res lines. There are different versions for these indicators, these two just happened to be my choice. Sorry, I don't have mql4 file for Sup/Res. It came with one of the emails - though free, but protected. I don't pay much attention to these indicators, only some general chart reading in two cases, I'll explain a bit later.

As for the template - for EFFI method I use an empty chart with the maximum zoom, only with BW MFI below: numbers, trend lines make enough mess by themselves. When I want to see the picture from another angle - I take a chart with Murray, SupRes, BW MFI, and some more of my tools, which I didn't disclose yet (I will). So, for now just make the chart comfortable for you.

P.S. I also like swings. I was very fond of them, and it took me a long time to learn trading trends too.

And one personal confession for everybody. You know the saying "The trend is your friend". I couldn't understand why I couldn't trade trends, always trying to find non-existing reversals, and not knowing what could be a sure sign of trend continuation. One happy day I got it - somewhere in my school years I was betrayed by a friend, and not once. For my subconsciousness the phrase "The trend is your friend" meant "It will betray you again". Once I understood that - I made one great step forward.
Attached File(s)
File Type: ex4 SupRes.ex4   16 KB | 137 downloads
File Type: mq4 Murray.mq4   10 KB | 135 downloads
 
 
  • Post #157
  • Quote
  • Edited 10:34pm Aug 16, 2013 10:17pm | Edited 10:34pm
  •  DrNoStopLoss
  • | Additional Username | Joined Mar 2013 | 317 Posts
Hello Shaltay,

How are you my friend? It seems like we have some thing in common. I wok as Data Analyst for NFP report, but I don't have inside trading information. Also did I mention to tell you my brothers wife is Russian. So let's open a bottle of vodka and drink as we take this method to the next level. Okay please see the attached picture. Do I have the indicators on correctly? I saved the template but want to make sure of your approval first. Next I will learn how to draw EFFI trend Lines but first I have a few questions:

1. When marking key candles are we only marking positive ones? Or are we only marking positive ones if we detect an uptrend and mark major negative ones in downtrend? I marked the key candles with a red check mark inside the bar, but this was done on the daily. Should I run the EFFI Index on the daily, H4, or another timeframe?

2. Are you only trading EUR/JPY pair right now, or are you looking at other pairs too such as EUR/USD and GBP/USD?

3 When drawing the trend lines what timeframe do you use? I would think we would use H4 or above more like D1. I see you use H1. I guess it more is related to what type of trade we are looking for, right? Short term, long term? Also how would you draw the EFFI trend lines on the attached pic. Maybe more examples with drawing trend lines will help so we can master drawing the lines. I will practice and display what I think the trend lines look like in the future and you can let me know if I am heaed the correct path.

4. I see you have 2 sell orders for EUR/JPY. I would do the same and the reason being, EFFI inside bar on the daily chart. Is this a correct way of thinking? I noticed you had the orders opened since the 14th and just wondering what made you decide to sell? Just want to learn how you are thinking.

Okay I am sure I will have many more questions in the near future, but I don't want to overwhelm you and I think it is better to take it one step at a time. Hope so far everything is okay. Thanks again soo much for everything you are doing so far and looking forward to your reply my friend.
Attached Image (click to enlarge)
Click to Enlarge

Name: EFFI1.jpg
Size: 301 KB
 
 
  • Post #158
  • Quote
  • Aug 17, 2013 8:37am Aug 17, 2013 8:37am
  •  Shaltay
  • | Joined Mar 2010 | Status: Member | 209 Posts
Hi Raymond,
Quoting DrNoStopLoss
Disliked
Do I have the indicators on correctly?
Ignored
Yes, the chart is nice, though I would like to know how you've chosen the colors for BWMFI+Volumes. Mine are: Green for (MFI up, Volume up); yellow for (MFI up, Volume down); blue for (MFI down, Volume up); brown for (MFI down, Volume down). What are yours? Check by BW MFI from MT4 standard indicator.
Quoting DrNoStopLoss
Disliked
1. When marking key candles are we only marking positive ones? Or are we only marking positive ones if we detect an uptrend and mark major negative ones in downtrend?
Ignored
Mark all effective candles, whatever is the direction. The minus is only a sign of a bearish candle, as a result of the mathematical calculation.
Quoting DrNoStopLoss
Disliked
Should I run the EFFI Index on the daily, H4, or another timeframe?
Ignored
I use it on any chart, except M1; and on M5 - occasionally.
Quoting DrNoStopLoss
Disliked
2. Are you only trading EUR/JPY pair right now, or are you looking at other pairs too such as EUR/USD and GBP/USD?
Ignored
Right now I trade only EUR/JPY, but I would be glad to have data from other pairs too. I'm ready to discuss any pair.
Quoting DrNoStopLoss
Disliked
3 When drawing the trend lines what timeframe do you use?
Ignored
For trend lines I use H1, H4, D1, W1. You are right, it depends on the type of trade (short term, long term) and available free time to monitor a trade.
Besides, I see that your D1 chart and my D1 chart are different - at different brokers and time zones. H1 chart may be the only chart which is more or less similar in all brokers.
Quoting DrNoStopLoss
Disliked
Also how would you draw the EFFI trend lines on the attached pic.
Ignored
Like this:
Attached Image (click to enlarge)
Click to Enlarge

Name: 2013-08-17_150114.gif
Size: 100 KB
Worth to note: The moves down create trend lines based on a pair of EFFI candles, the moves up don't have EFFI candles even for one trend line. I guess, this is quite in line with the visual impression that on D1 chart there is a channel sliding down. Sure, I will post more examples of drawing trend lines.
Quoting DrNoStopLoss
Disliked
4. I see you have 2 sell orders for EUR/JPY. I would do the same and the reason being, EFFI inside bar on the daily chart. Is this a correct way of thinking?
Ignored
When you see EFFI inside bar - it doesn't mean an immediate entry. You would place a pending order on any side which you think is more probable.
I opened those Sell trades because 1) there was a bullish reinforcement candle on H4 and I placed pending order for its breakout downwards (pic.1)
Attached Image (click to enlarge)
Click to Enlarge

Name: 2013-08-17_162843.gif
Size: 18 KB

2) I chose the direction downwards because the level of the pending orders was at the upper border of the D1 channel which I mentioned several lines above (pic.2)
Attached Image (click to enlarge)
Click to Enlarge

Name: 2013-08-17_163345.gif
Size: 15 KB
I will explain soon how to draw channels based on EFFI candles.
3) I still hold these trades because no H4 candles closed higher than the high prior to the first reinforcement candle. Besides, later there was one more bullish reinforcement candle, also broken downside, by a few pips though (pic.1). Certainly, who knows what can happened in the week end.
Important: Remember - a reinforcement candle must not exceed the last high or low. Otherwise it becomes just a common candle in the movement.

***

And one more idea to test for swing lovers. I assume that while there is only one or two EFFI candles in the movement - it is possible to trade the reversal by any oscillator indicator, to your choice. As soon as the third EFFI candle is formed, there are chances that this is an attempt to develop a trend, so be careful with oscillators.
You can choose any time frame for this tactic. BUT:
Check the higher time frames - they must also have not more than two EFFI candles in the direction prior to the supposed reversal. If the higher time frames have signs of a possible trend - chose swings only in the direction of that possible trend.
 
 
  • Post #159
  • Quote
  • Aug 17, 2013 9:03am Aug 17, 2013 9:03am
  •  DrNoStopLoss
  • | Additional Username | Joined Mar 2013 | 317 Posts
Thanks for the response. I have 2 quick questions based on your reply. I will get to the rest of the information later, need time to process and digest it to learn it properly.

1. I just placed the BWMFI+Volumes indicator on there. When I click on the properties, there is no way to determine which color is for MFI up Volume up, etc. Only numbers 0 to 5. Please let me know in your properties what number 1, 2, 3, 4 ,5 is. I changed it to:

0 = Black
1 = Green
2 = Yellow
3 = Blue
4 = Brown

Let me know if this is how you have it.

2. If our bars are different from broker to broker, wouldn't this give us different interpretations. For instance your D1 chart and my D1 chart looks different. So that would mean our trend lines are different, etc. How do we overcome this problem? Unless my chart is wrong somehow, but I do not know how. I just opened D1 and zoomed all the way in, unless you or I did something different to our charts. Maybe? Thanks again for taking the time to explain your wonderful system. These are it for the questions I have. Will go back into training and reading your notes before I ask more questions. Also doing voice exercises, so far yawning out loud for 5 mins at a time helps out greatly, I feel much more relaxed. Thanks.
Attached Image (click to enlarge)
Click to Enlarge

Name: EFFI2.jpg
Size: 240 KB
 
 
  • Post #160
  • Quote
  • Aug 17, 2013 10:21am Aug 17, 2013 10:21am
  •  Shaltay
  • | Joined Mar 2010 | Status: Member | 209 Posts
My BWMFI+Volumes colors are
Attached Image


Quoting DrNoStopLoss
Disliked
If our bars are different from broker to broker, wouldn't this give us different interpretations?
Ignored
It will, sure. Is it a problem? I don't think so. ( "Yep"... "Nope" - "Interstate 60") I can't see all possible trades on my charts, you will not see all possible trades on your charts, all of us will see their part of possible trades on their charts. For example, your posted picture of D1 chart is better for EFFI method then my D1 chart, in terms of trend lines. Next time it can be vice versa. You have a nice EFFI inside bar on D1, I also have it, but mine is ugly, with a small body and only 91 inside 86. So, you would probably play yours, I would probably miss mine, etc.
The task is to develop own vision for interpretations. We can discuss all interpretations, but must trade only our own situations.

Nice to hear about yawning. This exercise seems to be the favorite. I remember, a blogger wrote me back saying: "This is the first time in my life that I'm not afraid to tell somebody that I was constantly yawning while reading his article".
 
 
  • Trading Journals
  • /
  • Trial Run for Volume&Range Patterns
  • Reply to Thread
    • 1 67Page 8910 11
    • 1 7Page 89 11
0 traders viewing now
  • More
Top of Page
  • Facebook
  • Twitter
About FF
  • Mission
  • Products
  • User Guide
  • Media Kit
  • Blog
  • Contact
FF Products
  • Forums
  • Trades
  • Calendar
  • News
  • Market
  • Brokers
  • Trade Explorer
FF Website
  • Homepage
  • Search
  • Members
  • Report a Bug
Follow FF
  • Facebook
  • Twitter

FF Sister Sites:

  • Metals Mine
  • Energy EXCH
  • Crypto Craft

Forex Factory® is a brand of Fair Economy, Inc.

Terms of Service / ©2023