• Home
  • Forums
  • Trades
  • News
  • Calendar
  • Market
  • Brokers
  • Login
  • Join
  • 2:19pm
Menu
  • Forums
  • Trades
  • News
  • Calendar
  • Market
  • Brokers
  • Login
  • Join
  • 2:19pm
Sister Sites
  • Metals Mine
  • Energy EXCH
  • Crypto Craft

Options

Bookmark Thread

First Page First Unread Last Page Last Post

Print Thread

Similar Threads

PTZ Based on Volume Spread Analysis and Harmonic Patterns 1,748 replies

ECN && STP && Scalping && Hedging - Broker Review - Oct 2009 24 replies

What does volume tell us about the market? Volume patterns? 18 replies

Harmonic Patterns and Volume 2 replies

Price & Candlestick Patterns with S&R's - Trade Ideas 20 replies

  • Trading Journals
  • /
  • Reply to Thread
  • Subscribe
  • 134
Attachments: Trial Run for Volume&Range Patterns
Exit Attachments
Tags: Trial Run for Volume&Range Patterns
Cancel

Trial Run for Volume&Range Patterns

  • Last Post
  •  
  • Page 1 23456 11
  • Page 1 234 11
  •  
  • Post #1
  • Quote
  • First Post: Edited May 28, 2013 2:50am Nov 22, 2012 3:39pm | Edited May 28, 2013 2:50am
  •  Shaltay
  • | Joined Mar 2010 | Status: Member | 209 Posts
I'm in Forex since 2006. Three years ago I left office work, moved from a megapolis to a village and built a happy life in my own country house. I don’t earn all my living from Forex, I have another distant job I love, but Forex continues being a pleasant and profitable hobby.
The idea of this journal is to give trial run for a semi-mechanical system based on patterns of tick volume and candle range and gather convincing statistics in EURUSD, GBPUSD and EURJPY. Signals will not be frequent, the system is customized for free of stress trading, which leaves you time to enjoy sun and rain outside.
The template is simple. I use Murray Lines and Sup/Res lines as a road map, and standard BW MFI from MT4, though a bit updated and combined with Volumes.
I also use my own tools for signals, and I will not offer them and will not reveal the details of the system, until some day it proves to be what it is, and then this journal will be a public proof of success - or failure .
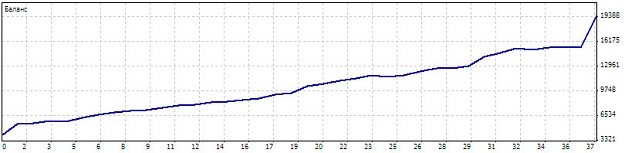
The system was good in October-November 2012 (see pic. 1 of the balance below). For this journal I started another demo account, from scratch, and will follow with a live micro account.

Update May 2013: I started disclosing some details about my trading in the post #107, 111 (http://www.forexfactory.com/showthre...86#post6692486), and ahead.

So, the first trade for now - BUY GBPUSD, by H4 chart. (pic. 2)
Attached Image(s) (click to enlarge)
Click to Enlarge

Name: BalanceDemo.jpg
Size: 35 KB
Click to Enlarge

Name: gbpusd-1.gif
Size: 23 KB
  • Post #2
  • Quote
  • Nov 22, 2012 11:44pm Nov 22, 2012 11:44pm
  •  Shaltay
  • | Joined Mar 2010 | Status: Member | 209 Posts
The days of November, 21 and 22, created a pattern on D1 chart of GBPUSD.
According to the system, November, 22, demonstrated visually and with signals that there was loss of interest, inability to go higher, and desire to stop.
At the same time the day 22.11 created disbalance in favour of bulls and an inner impulse for further activity.
I have little statistics for this pattern and hope that my interpretation if OK. I will continue keeping BUY trade (from the post#1), as I don’t see any contradicting signals on smaller TFs.
Attached Image
 
 
  • Post #3
  • Quote
  • Nov 23, 2012 4:29am Nov 23, 2012 4:29am
  •  fahrung
  • | Joined Apr 2012 | Status: Member | 20 Posts
Hi, Shaltay

What is your average pips target? I see you use a daily TF..
 
 
  • Post #4
  • Quote
  • Nov 23, 2012 6:17am Nov 23, 2012 6:17am
  •  Shaltay
  • | Joined Mar 2010 | Status: Member | 209 Posts
Hi Fahrung,
I use daily and weekly, and even montly TF for guidance. Main signals come from H4. I'm still in the process of arranging the clear logic for coordination of patterns on higher and smaller TF.
On demo I trade till any other signal, or to any sup/res zone. It can be from 40 to 100 pips and more. On live account I measure not pips, but gain. Ideally, it is 10% to the account from one trade. I use excel spreadsheet to calculate the reasonable size/risk/pips for a trade and an automated expert to close the trade at the given gain.
 
 
  • Post #5
  • Quote
  • Nov 23, 2012 10:06am Nov 23, 2012 10:06am
  •  Shaltay
  • | Joined Mar 2010 | Status: Member | 209 Posts
The sleepy Friday, Nov 23, has finally agreed to deliver 10% to my real micro account - from 31.7 pips (see the pic.) Don't pay attention to other figures than pips in the report line - it's a local currency.
The demo with the same trade is still running, protected to the small profit.
Have a nice weekend!
Attached Image (click to enlarge)
Click to Enlarge

Name: gbpusd-3.gif
Size: 36 KB
 
 
  • Post #6
  • Quote
  • Nov 25, 2012 10:47pm Nov 25, 2012 10:47pm
  •  Shaltay
  • | Joined Mar 2010 | Status: Member | 209 Posts
New week, Nov 26 - Dec 2, Monday survey.

EURJPY on weekly chart formed a signal: For 2-4 weeks from now the price will be slowly sliding down to 104, then it will continue higher than 107 (after New Year?). A signal from daily chart in EURJPY shows that the last strong movement was created mainly due to speculation activities. I’ll wait for strong down signals on daily and H4 charts to sell the pair.

No signals from weekly chart in EURUSD. No clear signals from daily chart in EURUSD, but half of the forming pattern here says: wait one more day to decide – up or down.

No signals from weekly chart in GBPUSD. A signal on daily chart in GBPUSD tells about too much enthusiasm on last Friday, though supported with real money. The signal says - No trades here today, it can be whatever – up or down, or flat very likely.

To resume, today I will monitor only EURJPY. From what I see at the beginning of the session, signals on H4 chart may appear not earlier than 8 hours later.

So, I’m out for a walk with my dog, in the fresh snow here.
 
 
  • Post #7
  • Quote
  • Edited 10:30am Nov 26, 2012 9:29am | Edited 10:30am
  •  Shaltay
  • | Joined Mar 2010 | Status: Member | 209 Posts
Still no trading signals in EURJPY. Now a fresh pattern on H4 confirmed that the period of hesitations around Pivot continues. I was ready to agree to take signals from H1, but even there – nothing.

H4 chart in GBPUSD brought a Sell signal (pic). It would be good, in another situation, but now it contradicts the D1 chart and the general rule – don’t trade patterns from a smaller TF, if a forming pattern on a higher TF is not completed yet. I ignore this signal.

No trades for today. Instead I built a new winter bird feeder in my garden. Another practical gain - I found a new pattern in GBPUSD, will gather statistics. I didn't pay much attention to it, but it seems good for quick channel trades and confirmation of the trend force.
Attached Image
 
 
  • Post #8
  • Quote
  • Nov 26, 2012 10:52pm Nov 26, 2012 10:52pm
  •  Shaltay
  • | Joined Mar 2010 | Status: Member | 209 Posts
For Nov 27.
Daily chart in EURUSD formed a pattern of uncertainty. With no action signals from weekly and daily charts, I will trade signals on H4. Meanwhile, nothing visible even on H1.

Daily chart in GBPUSD formed a pattern which says: "Don’t sell, upward movement will continue". I will wait for Buy signals on H4 and M30 (while I’m at the comp and with a sound alert if any).

Note: Why it is possible to take M30 signals in GBPUSD, but not in EURUSD? Because in GBPUSD there is a "patter of action", and in EURUSD there is a "pattern of patience" which demands strong signals to break it.

Daily chart in EURJPY brought no changes. I continue waiting for Sell signals on H4.
Attached Image (click to enlarge)
Click to Enlarge

Name: dailyprognos1.gif
Size: 55 KB
 
 
  • Post #9
  • Quote
  • Edited 2:33am Nov 27, 2012 1:50am | Edited 2:33am
  •  Shaltay
  • | Joined Mar 2010 | Status: Member | 209 Posts
Buy pattern appeared on M30 in GBPUSD (pic), a Buy trade is open on demo and live.

Sell pattern appeared on H1 in EURJPY (pic). A Sell trade is open only on demo -I prefer to avoid trades, when price is close to 7/8 or 1/7 levels of Murray lines, but now my "buttonpushing" mood is ruling. Besides, one more pattern on H1 may be formed soon, if it is what I expect - I will open a Sell trade on live account.

Edited: And yes, I opened Sell in EURJPY on live as well. Even if it doesn't work immediately, I will keep it alive, because this is the idea from the post#6 about the weekly pattern, and playing weekly patterns is a loooooong story.
Attached Images
 
 
  • Post #10
  • Quote
  • Nov 27, 2012 12:29pm Nov 27, 2012 12:29pm
  •  Shaltay
  • | Joined Mar 2010 | Status: Member | 209 Posts
I continue keeping my recent Buy trade in GBPUSD and Sell trade in EURJPY.

Current testing has revealed some advantages of the system:
– it can filter flat market, there will be no signals/patterns in such market
– it can generate a whole row of unidirectional signals/patterns at the edge of a strong movement, thus predicting it.

And disadvantages:
– it isn’t customized for the best entry points, though they happen in 50% of cases. Lagging in realization and drawdowns of 20-40 pips are another 50%. (Not a problem for me)
– it can miss countertrend movements of 50-80 pips, considering them insignificant. At the same time it can predict movements of 30-50 pips if they go with the trend. (Sometimes it’s a pity)
– it can generate a whole row of multidirectional (thus confusing) signals/patterns. Fortunately, the rules of the system help to avoid such indecisive market, though price swings may look nice.

I don't speak of SL method now, I certainly have it, it will be in the rules.
 
 
  • Post #11
  • Quote
  • Nov 27, 2012 5:21pm Nov 27, 2012 5:21pm
  •  Shaltay
  • | Joined Mar 2010 | Status: Member | 209 Posts
Nov. 28
Daily chart in EURJPY formed a signal/pattern which says: “Trade opposite to the first breakout” (pic. later). If the price goes down first, it will radically change my trading plans in EURJPY and will confirm the strength of uptrend. My Sell is protected with some profit, and I will put TP at the low of Nov. 27 and a pending Buy order somewhere near.

Daily chart in GBPUSD formed a signal/pattern too, but it is rare, and I’m not sure about it yet, will continue with the previous Buy trade here. Besides, there is a single pattern (outside the system), which I call “a tango pair”, this one says – up. (pic. later)

Nothing new in EURUSD, the mess of up and down signals.
 
 
  • Post #12
  • Quote
  • Edited 5:19am Nov 28, 2012 1:45am | Edited 5:19am
  •  Shaltay
  • | Joined Mar 2010 | Status: Member | 209 Posts
Oops - Once more proof that the system is not for pending orders (to add to the rules with red letters). I shouldn't place a pending Buy order in EURJPY. Instead I should wait for a signal to Buy, still no signs of it. Nevertheless, I'll keep this misplaced Buy trade, because the pattern says that the main movement will be "opposite to the first breakout".
In general - I'm happy with the nice realization of the initial trading plan in EURJPY, according to the weekly pattern (from post #6). Another "plus" for this pattern. It is not frequent, but every time follows its way.
A few words about the main idea of the system - the patterns are created by the combinations of BW MFI bars, with/without Dots and Diamonds signals (from my tool) and with the Status of the last bar in the pattern (my tool - YYN, NYN etc). I don't give exact details of the system now not to provoke anybody to try it immediately. Why should you spend your trading time for what may turn useless at the end of the story? Thank you for your reading time which you give me following this thread!
 
 
  • Post #13
  • Quote
  • Nov 28, 2012 1:21pm Nov 28, 2012 1:21pm
  •  Shaltay
  • | Joined Mar 2010 | Status: Member | 209 Posts
GBPUSD and EURJPY gave the perfect reversal signal for Buy – at the same time and with the same parameters. Two more pluses for this pattern.
Instead of my wrong pending Buy order in EURJPY (which I put yesterday for the night) I should be waiting for this reversal signal. Today in EURJPY it was the first Buy signal (by my system)
Attached Images
 
 
  • Post #14
  • Quote
  • Nov 29, 2012 6:00am Nov 29, 2012 6:00am
  •  Shaltay
  • | Joined Mar 2010 | Status: Member | 209 Posts
Countertrend pattern in EURJPY (pic). It could a Sell for 35-40 pips here, if there were not previous Buy signals from weekly and daily charts. I will buy at the pullback - if it happenes; if not - good for the confirmation of the uptrend force.

Still keep a Buy trade in GBPUSD, no reasonable signals to kill it.

So, by this moment (since Nov 23) I have 18% (to the initial account) of closed profit on the live account and some profit running; 20% of closed profit on demo, because I tried some small signals there.
Attached Image
 
 
  • Post #15
  • Quote
  • Nov 29, 2012 9:48am Nov 29, 2012 9:48am
  •  Shaltay
  • | Joined Mar 2010 | Status: Member | 209 Posts
EURUSD gave a row of Buy signals on H1 and a Sell signal on H4. According to the rules, signals from smaller TF can't cancel signals from higher TF, though they can slowdown their implementation.
I would say, from the previous testing, that EURUSD will continue up now, but then it should return at least to 1.2985 (the price of the Sell signal). I can't say how much it will go up, too many up signals on H1, though one of this signals (Red diamond) says that bears have already tried to break the move, but without success. Now, I guess, the situation will depend on bears' stoplosses.
Attached Image (click to enlarge)
Click to Enlarge

Name: eurusd-1.gif
Size: 32 KB
 
 
  • Post #16
  • Quote
  • Nov 30, 2012 2:44am Nov 30, 2012 2:44am
  •  Shaltay
  • | Joined Mar 2010 | Status: Member | 209 Posts
EURJPY gave two opposite signals in a row on H4: Two candles together - for Sell, but in the trending market - for possible pullback to 106.70; the second candle with Green diamond - for Buy.
I don't take such Sell signals in EURJPY now (they are contradicting previous Buy signals from the higher TFs).
Murray lines on H1 moved, giving more room for up, I expect EURJPY at 107.80 today.
My ugly Buy trade in GBPUSD finally has started implementating the Buy signal from daily chart on Nov 23-27. What a trap for bears in two marked candles! My system clearly and twice says "Buy" here.
Attached Images
 
 
  • Post #17
  • Quote
  • Dec 3, 2012 3:36am Dec 3, 2012 3:36am
  •  Shaltay
  • | Joined Mar 2010 | Status: Member | 209 Posts
New week, Dec 3

GBPUSD gave mixed signal on the weekly chart - two bars together for down and the second bar alone for up (pic). So far such puzzles were solved with the signals from the smaller TFs. Nothing on the daily chart today. I will look for signals on H4 chart - if there is something for Sell. Meanwhile I keep the Buy trade in GBPUSD running.

Weekly and daily charts in EURJPY (the same in EURUSD) confirm upward movement. I keep the Buy trade in EURJPY running.
Attached Image
 
 
  • Post #18
  • Quote
  • Dec 3, 2012 5:40am Dec 3, 2012 5:40am
  •  Shaltay
  • | Joined Mar 2010 | Status: Member | 209 Posts
H4 chart in GBPUSD brought a signal for a channel between 1.6020 - 1.6060. I closed Buy trade at 1.60547.

It is not a signal for Sell yet, but it can be a Stop signal; since my Buy entry is close, so I prefer to take the profit (with mixed Buy/Sell signals from weekly chart in view).
Attached Image
 
 
  • Post #19
  • Quote
  • Dec 3, 2012 10:55pm Dec 3, 2012 10:55pm
  •  Shaltay
  • | Joined Mar 2010 | Status: Member | 209 Posts
Dec 3
EURJPY created a pattern of uncertainty (no wonder after two days in a range). I minimized H1 chart here and will be watching H4 signals. While none of them - I keep the Buy trade alive.

EURUSD and GBPUSD give no signals on daily charts - neither for reversal, no for continuation. Inertial upward movement is quite possible, and I'll be waiting for H4 signals here.

Back to the previous prognoses: In general, the idea that GBPUSD will move higher than Nov 23 was determined correctly by the signals. My mistake, though, - en early entry.
To add to the rules:
After a pattern of uncertainty (PU) wait for signals from the next smaller TF (for example, if PU is on the daily chart, trade the signals from H4 chart. My mistake in GBPUSD was that with PU on D1 I took a signal from M30).
After a pattern of action (PA) wait for signals from the next smaller TF and the following one (for example, if PA is on the daily chart, trade the signals from H4 chart and H1 chart).
 
 
  • Post #20
  • Quote
  • Dec 4, 2012 3:04am Dec 4, 2012 3:04am
  •  Shaltay
  • | Joined Mar 2010 | Status: Member | 209 Posts
EURUSD gave a Buy signal on H4 - I missed it on live account, took on demo for scalp, to verify the pattern.

I don't see enough steam in the pair to break higher immediately, pullback to 1.3015 would refresh the bulls mood.
Attached Image
 
 
  • Trading Journals
  • /
  • Trial Run for Volume&Range Patterns
  • Reply to Thread
    • Page 1 23456 11
    • Page 1 234 11
0 traders viewing now
  • More
Top of Page
  • Facebook
  • Twitter
About FF
  • Mission
  • Products
  • User Guide
  • Media Kit
  • Blog
  • Contact
FF Products
  • Forums
  • Trades
  • Calendar
  • News
  • Market
  • Brokers
  • Trade Explorer
FF Website
  • Homepage
  • Search
  • Members
  • Report a Bug
Follow FF
  • Facebook
  • Twitter

FF Sister Sites:

  • Metals Mine
  • Energy EXCH
  • Crypto Craft

Forex Factory® is a brand of Fair Economy, Inc.

Terms of Service / ©2023