• Home
  • Forums
  • Trades
  • News
  • Calendar
  • Market
  • Brokers
  • Login
  • Join
  • 1:56pm
Menu
  • Forums
  • Trades
  • News
  • Calendar
  • Market
  • Brokers
  • Login
  • Join
  • 1:56pm
Sister Sites
  • Metals Mine
  • Energy EXCH
  • Crypto Craft

Options

Bookmark Thread

First Page First Unread Last Page Last Post

Print Thread

Similar Threads

PTZ Based on Volume Spread Analysis and Harmonic Patterns 1,748 replies

ECN && STP && Scalping && Hedging - Broker Review - Oct 2009 24 replies

What does volume tell us about the market? Volume patterns? 18 replies

Harmonic Patterns and Volume 2 replies

Price & Candlestick Patterns with S&R's - Trade Ideas 20 replies

  • Trading Journals
  • /
  • Reply to Thread
  • Subscribe
  • 134
Attachments: Trial Run for Volume&Range Patterns
Exit Attachments
Tags: Trial Run for Volume&Range Patterns
Cancel

Trial Run for Volume&Range Patterns

  • Last Post
  •  
  • 1 45Page 678 11
  • 1 5Page 67 11
  •  
  • Post #101
  • Quote
  • Feb 12, 2013 3:12am Feb 12, 2013 3:12am
  •  Shaltay
  • | Joined Mar 2010 | Status: Member | 209 Posts
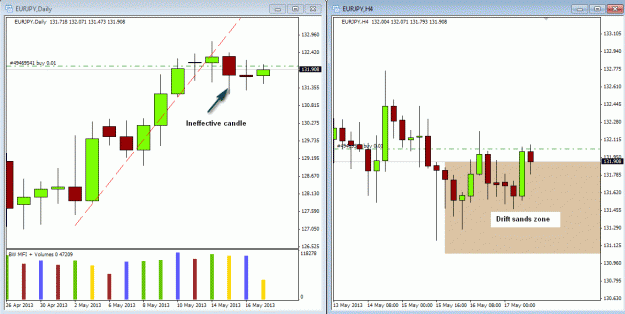
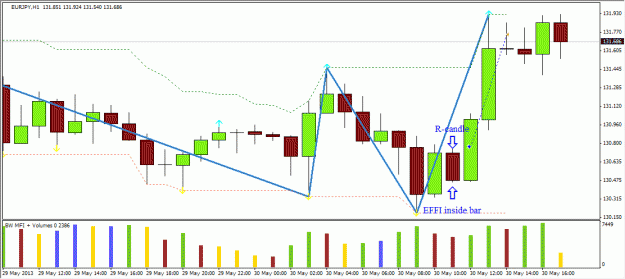
EURJPY is stuck. It repeatedly creates a pattern which I called "A Stubborne Mule", and it creates them to opposite sides, in a row. An absolutely rare situation, this is pattern for a trendy day. I guess, this is the evidence, that the pair lost its way... I wonder, will it build a triangle flag from such candles?

The expert closed +10% on the live account in GBPUSD, demo closed manually. The percentage of profit doesn't coinside on demo and live, though the lots were proportional (the starting amount was different on 23.01 when the demo was created).
Attached Image
 
 
  • Post #102
  • Quote
  • Edited 5:53am Feb 12, 2013 5:33am | Edited 5:53am
  •  Shaltay
  • | Joined Mar 2010 | Status: Member | 209 Posts
Update: OK, D1 pattern activated, Sell closed, small Buy opened, will add Buys now.

*******

EURJPY sold by the pattern "Yellow Blues" on H4. A bit risky, because D1 has another pattern which, if activated, will be for upwards. While it is not activated, I'm trying to Sell with the smallest lot, to add if it really develops down. In "Yellow Blues" it can take some time.
Attached Image
 
 
  • Post #103
  • Quote
  • Feb 14, 2013 4:09am Feb 14, 2013 4:09am
  •  Shaltay
  • | Joined Mar 2010 | Status: Member | 209 Posts
EURJPY is frozen after G7 statement and will probably unfreeze only some time after G20 session. Meanwhile I found one more interesting idea for the system and even received already a coded tool from MQL specialist (he was so quick!). The tool helps to verify probabilities in case of doubts. It confirmed the force of downward movement in GBPUSD, and one more fall did happen. And the tool confirms the upward force in EURJPY. No other signals from my system, as usual in the choppy market. Its range gives many chances for other styles to earn, I even made about 2% yesterday (live) while playing with the new tool, but I don't enjoy the process. So I just leave my Buy positions to live, and will do something different. The weather is so sunny today!
 
 
  • Post #104
  • Quote
  • Feb 15, 2013 4:28am Feb 15, 2013 4:28am
  •  Shaltay
  • | Joined Mar 2010 | Status: Member | 209 Posts
It't time to say Good Bye! I'm going to play va-bank and leave my positions through the weekend and G20 session. I've just made one more withdrawal from the live account and now I have back my investments plus 100% of net profit in my pocket. Testing was fun, a lot of information gathered in the field, a lot of patterns and their details became much clearer, and now I can advance with mastering the method. My big gratitude to everybody who was reading this thread. Your attention kept me in tonus and supported my discipline

After today's withdrawal the percentage of profit/loss is much closer in demo and live. Though I don't know if I ever be back to this journal (because my own websites beg for my attention), I leave the demo Trade Explorer as it is for a while. If there is a margin call - you will know If not - the trades will remain approximately the same on demo and live.

One more big "Thank You All!" and wish you good luck and happy trading!
 
 
  • Post #105
  • Quote
  • Feb 21, 2013 6:14am Feb 21, 2013 6:14am
  •  Shaltay
  • | Joined Mar 2010 | Status: Member | 209 Posts
I cut the losses in EURJPY, following the rules of the pattern from D1 chart which I played. The system is good reflecting the driving force created by the majority of the market players, but it is helpless against the ideas of the major market players. Even in the very last move upwards the system kept confirming that the bulls in this pair are stronger and more enthusiastic.
The total gain on the live account since Nov 22, 2012 is 268%, the loss of Feb is 12,8%. (The demo remains in TE.) I've ordered one more withdrawal, and the rest on the live account is now about $100 again, these are the "money of the house" for the next stage of testing, and I've already earned=took out my initial investments and enough to pay my Internet and mobile phone bills for 4 month.
With all my devotion to Forex (even when I used to say that I would "never again...", I was back not more than in a month), well, with all my devotion Forex is a hobby, and now with the coming spring the hobby of gardening becomes more interesting for me. So I will be looking for the signals only on Weekly and Daily charts, and only 1-2 strong signals on H4 charts.
 
 
  • Post #106
  • Quote
  • Apr 4, 2013 2:22pm Apr 4, 2013 2:22pm
  •  Shaltay
  • | Joined Mar 2010 | Status: Member | 209 Posts
I'm obviously possessed by the seasonal mood of sabotaging forex - I neglect the signals from the system and perfectly perform excellent entries in bad positions and stupid exits from good trades. Years ago, when I didn't understand yet that my trading depended so much on my mood, I would let the losses run till the margin call to feel free after that. But one day a friend said: "If you don't want to trade - don't trade. But your money are not guilty, don't kill them in your account. Take them, or let them wait for your comeback one day, but don't hate them!" So I quit for a while now.
Nevertheless, my live account is not bad, I ended February not with minus 12,8% as I wrote in the previous post, but only with minus 3,17%; in March I gained 87,27% (to the amount on March 1); and now I closed everything with minus 9.92% to the amount on April 1 (in total 383% from the start of the journey on November 2012). The demo account has the worse percentage, I didn't manage to keep demo and live MM equal.
Also, in this period I experimented with trading not only my 3 favorite pairs, but everything around, whenever a signal. Not the best practice for me: though several signals were nice, in general I missed or misinterpreted a lot of them. Really, in my case, the lack of interest spoils everything
 
 
  • Post #107
  • Quote
  • May 15, 2013 4:25pm May 15, 2013 4:25pm
  •  Shaltay
  • | Joined Mar 2010 | Status: Member | 209 Posts
An invitation – to whom it may be interesting.

Half a year passed since the start of testing, and it is not bad. Live account in April was in profit (+5.69%), and today it is 37,66% up (every time counting from the amount on the first day of the month). The compounding growth is 519% from November 20, 2012. (As for the demo account - you can see it in the Trade Explorer, though it differs from the live one a bit).

As I wrote in the first post, there was no sense to disclose details until testing proves that the idea is profitable. I continue believing that my system in whole is my own affair, sometimes good, sometimes questionable, but here is the good news.

In the course of testing I’ve developed a very interesting tool, and an MQL4 specialist coded it for me as a script. I refined it several times, and finally it became for me a kind of a real insider. I called it – The Efficiency Method (EFFI Method), and EFFI Index tool.

It can be useful for supply/demand jumpers, pin catchers, trend lines and inside bars breakers, and scalpers. It works in trends and in swings. It works on TFs from M5 to D1 (I didn’t tested it on M1, W, Mn). In other words, you can add it to your individual trading style without forcing yourself to adapt to an alien system.

I see so many possibilities in this tool, that I simply can’t embrace them alone, it would take a lot of time, because I trade not often and only in one pair now. So I invite you to try this tool in your trading and to share your experience.

But now the “bad” news:

1) EFFI Disclaimer: The EFFI Method is my own conception based on my personal assumptions, and the EFFI Index tool is my product based on my own logical elaborations, which I will try to explain, but you may not agree. While the method works for me, it can arouse certain doubts in you. To use or not to use it in live trading will be your own choice and responsibility, and you confirm that you agree with it by the fact of joining this quest.

2) I offer the tool and the method for free, no sales around it, but I want to keep my brainchild in my own hands, and I will post main ideas and explanations in my own blog, while the everyday discussion will remain in FF forum as a trading journal (with all my respect to this wonderful community built with so many efforts).

With all that said – if you feel interested, drop a line here and say in a few words what is your trading style (in TFs and methods, as above). Then I will be able to prepare a good launch of the method, starting from the most popular demand.
 
 
  • Post #108
  • Quote
  • May 16, 2013 1:36am May 16, 2013 1:36am
  •  Shaltay
  • | Joined Mar 2010 | Status: Member | 209 Posts
Just one quick note - I don't mean to ask for details of your trading style, but just like that, here in the thread: "I prefer H1 and swings", or "I prefer M30 and scalping" etc.
 
 
  • Post #109
  • Quote
  • May 17, 2013 6:04am May 17, 2013 6:04am
  •  Shaltay
  • | Joined Mar 2010 | Status: Member | 209 Posts
I had a small short in EURJPY at 131.80 opened at the break of the trend line on D1 and aiming at least at 100 pips lower. But the next after the breakout bearish daily candle was ineffective. Moreover, on H4 the price stuck in the drift sands – a flat zone, where buyers and sellers feel more or less comfortable until they find another idea where to move.
Just recently on H4 the candle closed above this flat zone. I closed my Sell and opened a small Buy. But if H4 candle closes in the zone again, I will cut my Buy too and will wait for another market situation.
Attached Image (click to enlarge)
Click to Enlarge

Name: 2013-05-17_135606.gif
Size: 33 KB
 
 
  • Post #110
  • Quote
  • May 17, 2013 9:33am May 17, 2013 9:33am
  •  Shaltay
  • | Joined Mar 2010 | Status: Member | 209 Posts
How interesting! I assumed that if the price comes back from far away and penetrates a “sand” zone created on any TF, a candle from this TF will try to close inside this zone. The sand zone on the previous picture was made in fact of two zones. The lower (1) was penetrated and rejected several times yesterday, but now the candle closed inside it, and the assumption got a confirmation.
And with all that I also get a confirmation for the classification of such zones by the efficiency of the candles that created them. The lower zone on my picture is stronger than the upper one (2), and didn't remain inactivated. Very interesting! It gives a possibility to predict choppy periods, I believe.
Attached Image
 
 
  • Post #111
  • Quote
  • May 20, 2013 10:13am May 20, 2013 10:13am
  •  Shaltay
  • | Joined Mar 2010 | Status: Member | 209 Posts
I've launched my website with the first post introducing the EFFI Method and the EFFI Index tool. This website is not for wide public, it is a place which gives the possibility to edit, add and rearrange information at any moment. No social sharing buttons, no subscription form, and no comments there. If you want to follow - follow this thread, I will post here about the updates there.

You can download the EFFI Index tool from my website at
http://www.effimethod.com/introducti...x-tool/#more-9

One personal request: the design is more than minimalistic now, and I'm afraid that the font, though good sized for Chrome, needs smaller resizing in Mozilla. If you have any feedback on this, I would be very grateful.
 
 
  • Post #112
  • Quote
  • May 20, 2013 11:04am May 20, 2013 11:04am
  •  Shaltay
  • | Joined Mar 2010 | Status: Member | 209 Posts
I opened a Sell in EURUSD from the Supply zone on H4, and this time my placement (found and refined with EFFI Index tool) coincides with the swap level in the classical SupDem method. You can doubt about its freshness, but for me it is fresh. Nevertheless, I didn't expected a strong reaction from it, because the price entered a drift sand zone on D1 chart (a zone of compromise and temporary balance). On M5 you can see how the price is rejected by the lower border of this daily zone.

Moreover, from 1.2837 and lower there is one more sand zone, on H4 this time, protecting from the move to the main demand zone at the bottom. With all that, I have enough reasons to continue selling the pair, but don't expect strong volatility and quick target taking, if only some breaking news.
Attached Image (click to enlarge)
Click to Enlarge

Name: 2013-05-20_184943.jpg
Size: 206 KB
 
 
  • Post #113
  • Quote
  • May 21, 2013 4:42pm May 21, 2013 4:42pm
  •  Shaltay
  • | Joined Mar 2010 | Status: Member | 209 Posts
I've posted un update explaining the main idea how to use EFFI numbers.
http://www.effimethod.com/the-legend-of-effi-numbers/
 
 
  • Post #114
  • Quote
  • May 22, 2013 8:20am May 22, 2013 8:20am
  •  Shaltay
  • | Joined Mar 2010 | Status: Member | 209 Posts
Would I not choose to follow the general Sell idea in EURUSD offered by my system (that is why I looked for the levels to Sell), I would choose a Buy possibility at 1.2850, as at the picture, following the indications of the pure EFFI Method. The percentage of successful trades on the entries of this type is high, and the stop-loss is usually comfortable, especially when trading on M5 chart.

Read about the Hidden EFFI Divergence and the Model of the Broken Reinforcement here
http://www.effimethod.com/hidden-eff...reinforcement/
Attached Image (click to enlarge)
Click to Enlarge

Name: 2013-05-22_161241.gif
Size: 17 KB
 
 
  • Post #115
  • Quote
  • May 23, 2013 5:11am May 23, 2013 5:11am
  •  Shaltay
  • | Joined Mar 2010 | Status: Member | 209 Posts
Sell in EURUSD from 1.2868 stopped at BE, there was no sense to keep it longer. ("Sorry, I couldn't," the old horse sighed after the races.) Buy limit triggered in EURJPY at 130.11 (set long ago). Hope for better dips to add Buys.
 
 
  • Post #116
  • Quote
  • May 23, 2013 2:28pm May 23, 2013 2:28pm
  •  Shaltay
  • | Joined Mar 2010 | Status: Member | 209 Posts
EURJPY Buy #2 was opened at the breakout of the model of bearish reinforcement on M15. Buy #3 was opened at the minor supply level on M15. (Picture). Buy #1, as said, was opened at the major supply level on H4, with a Buy Limit order. Now there is model of bullish reinforcement on M15, and I moved SL for all three positions below that candle.
Attached Image (click to enlarge)
Click to Enlarge

Name: 2013-05-23_151438.gif
Size: 27 KB
 
 
  • Post #117
  • Quote
  • May 30, 2013 10:26am May 30, 2013 10:26am
  •  Shaltay
  • | Joined Mar 2010 | Status: Member | 209 Posts
After the period of swings sliding down in EURJPY a reinforcement candle appeared, and the model of the broken reinforcement worked perfectly. It was twice a surefire setup because R-candle was at the same time EFFI inside bar. The trade brought about 100 pips.

How to find the Champions of inside bars – read here
http://www.effimethod.com/effi-metho...-best/#more-49
Attached Image (click to enlarge)
Click to Enlarge

Name: 2013-05-30_181907.gif
Size: 23 KB
 
 
  • Post #118
  • Quote
  • Jun 6, 2013 4:58am Jun 6, 2013 4:58am
  •  Shaltay
  • | Joined Mar 2010 | Status: Member | 209 Posts
This Sell trade in EURJPY (pic) was opened with one more EFFI approach, which, I believe, is quite good in terms of R/R ratio and allows to find a safe entry even in the flat market. This position was open during consolidation, when I did believe in the move downwards, but didn’t have any visible indications to confirm it. The trade took many hours to develop and didn’t become the perfect example, but it worked as expected. I exited too early from it, but this is another story.


If you work with M5 charts, at least sometimes, read the details here http://www.effimethod.com/how-to-fin...dency/#more-64
Attached Image (click to enlarge)
Click to Enlarge

Name: Sell-at-M5-EURJPY.gif
Size: 19 KB
 
 
  • Post #119
  • Quote
  • Jun 11, 2013 7:45am Jun 11, 2013 7:45am
  •  Shaltay
  • | Joined Mar 2010 | Status: Member | 209 Posts
I didn't take exactly these levels for my SELLs in EURJPY, but here is the nice example of the fruitfull breakout of EFFI inside bars. (pic)
Attached Image (click to enlarge)
Click to Enlarge

Name: 2013-06-11_154134.gif
Size: 24 KB
 
 
  • Post #120
  • Quote
  • Jun 27, 2013 9:22am Jun 27, 2013 9:22am
  •  Shaltay
  • | Joined Mar 2010 | Status: Member | 209 Posts
I was developing the idea of EFFI trend line, but it started growing wider and wider - first, to a separate chapter inside EFFI method, and now it pretends becoming a whole trading system. I'm not sure, whether I should go so deep... Some aspects remain raw assumptions that need statistics yet, and sometimes it costs me money, but paper trading is boring. Nevertheless, the basics are already clear, and here what it is about:

http://www.effimethod.com/new-look-o...lines/#more-78

I’ve made an attempt with a video, but it greatly loses in quality and grows in size while converting to any online format. So there are video slides there and an option to download 2:07 min./3,52 Mb in Zip for Windows Media Player.
 
 
  • Trading Journals
  • /
  • Trial Run for Volume&Range Patterns
  • Reply to Thread
    • 1 45Page 678 11
    • 1 5Page 67 11
0 traders viewing now
  • More
Top of Page
  • Facebook
  • Twitter
About FF
  • Mission
  • Products
  • User Guide
  • Media Kit
  • Blog
  • Contact
FF Products
  • Forums
  • Trades
  • Calendar
  • News
  • Market
  • Brokers
  • Trade Explorer
FF Website
  • Homepage
  • Search
  • Members
  • Report a Bug
Follow FF
  • Facebook
  • Twitter

FF Sister Sites:

  • Metals Mine
  • Energy EXCH
  • Crypto Craft

Forex Factory® is a brand of Fair Economy, Inc.

Terms of Service / ©2023