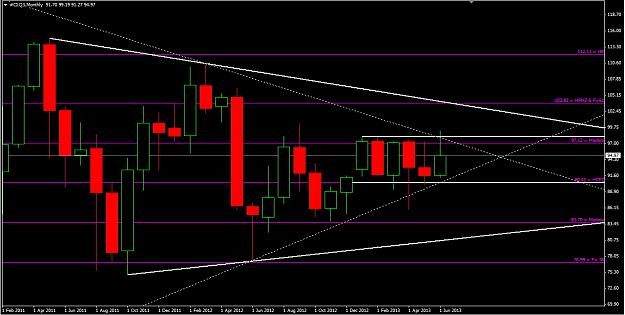
The monthly and weekly Crude Oil charts showing approximately 9-month triangle within a 3+ year triangle.
It’s a complicated chart for me, its looks bullish at this time and fundamentally it should go upward but you can see it’s failed to make a HH or close above minimum 98.50 on monthly chart.
There are only 5 days left of month of June. And it’s trading at 95.30. on a larger time frame 90.50 area looks strong support, but, close below the point its open for a big drop?
90.50 is the mid of 33.56 to 147.26 as well. The upward breakout on smaller time frame with an inverse H&S and the smaller symmetrical converted into classic bull trap?
Targets are the lower TL of the smaller symmetrical looks 86.70 and the bigger triangle TL at 81.72, the target of the smaller triangle at 72?
But, the question is that this kind of drop is possible because producers must make money?