Well my stuff tell me it's almost over and the sellers start to come in around here! So you might be right because it sure looks like it on my end. I might add to my shorts up here!!!
{quote} we tested the low of yesterday PA rejected the low..we then enter a period of consolidation..breaking out north and now the high of yesterday has gone, after the low yesterday gone!! in effect bullish engulf on yesterday movement what if i may ask is the reason for the conviction??..what are u seeing in yur charts
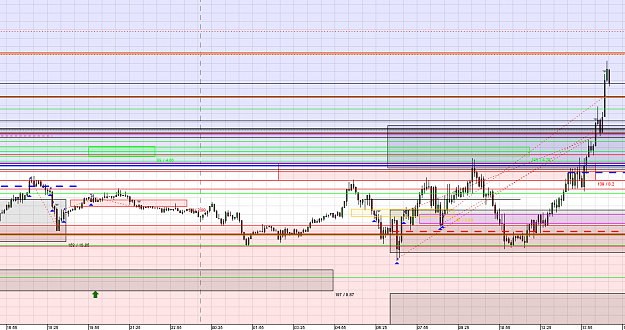
Most logical short spot is on 5787 61.8Fib on weekly chart. Anything less is riskier to me not worth, happens to touch important 200MA floating S/R This is a classic Gartley pattern forming AB=CD {image}
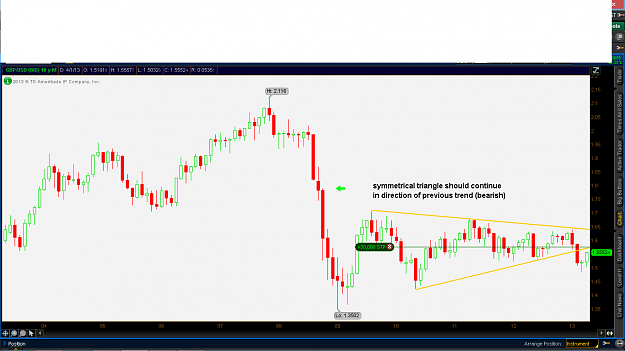
lol stock chart traingle and yours are different, yur observations are poor
first off..notice how the traingle is defined (think about what it actually is?)
hopefully u should have come up with, An area of tight compression which would lead to a breakout of the defined area, what yur posting cannot be used to trade effectively as its not accurate enough, u cannot see the area of compression accurate enough..there was never breakout to the downside, infact the trendline held perfectly and broke to the topside..giving a signal of breakout north
any1 can do the lines but they have to be accurate to actually work
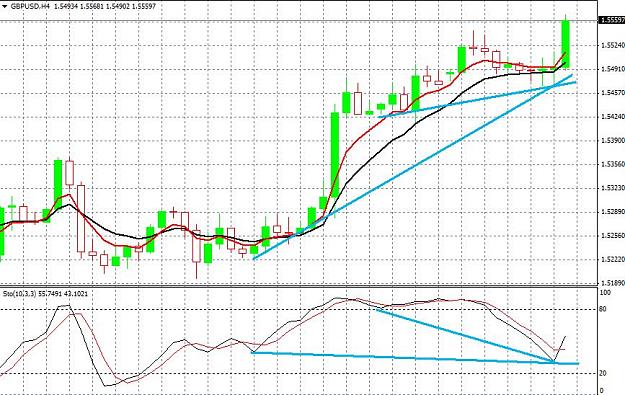
My demo account has never looked so healthy Anyway, nice spot of divergence on the 4HR chart. {image}
Ignored
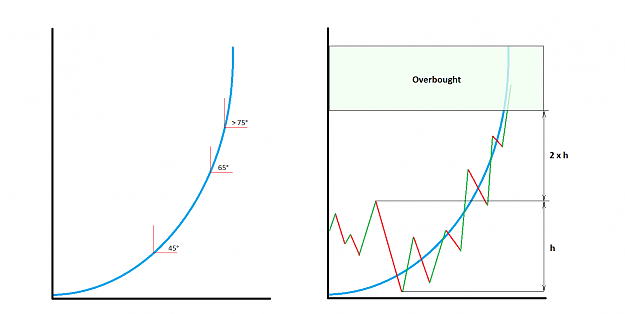
You dount need these indicators to see if parabolic swing is overextended.. What you should concentrate on is where initial pushers are going to take their profits..
{quote} You dount need these indicators to see if parabolic swing is overextended.. What you should concentrate on is where initial pushers are going to take their profits..
{quote} lol stock chart traingle and yours are different, yur observations are poor first off..notice how the traingle is defined (think about what it actually is?) hopefully u should have come up with, An area of tight compression which would lead to a breakout of the defined area, what yur posting cannot be used to trade effectively as its not accurate enough, u cannot see the area of compression accurate enough..there was never breakout to the downside, infact the trendline held perfectly and broke to the topside..giving a signal of breakout...
Ignored
Not sure how my triangle is different, it looks the exact same.
Quote
Disliked
"The pattern is identified by drawing two trendlines that connect a series of sequentially lower peaks and a series of sequentially higher troughs. Both trendlines act as barriers that prevent the price from heading higher or lower, but once the price breaches one of these levels, a sharp movement often follows."
{quote} You dount need these indicators to see if parabolic swing is overextended.. What you should concentrate on is where initial pushers are going to take their profits..
Ignored
What is parabolic swing? I have never seen that term mentioned before. All google turned up was some parabolic sar stuff.
Anyway, I typically use divergence as confirmation I am going in the right direction. That chart is also part of my mop up strategy, which is indi based but is combined with price zones. I prefer to use candle sticks and patterns such as double tops and bottoms.
{quote} What is parabolic swing? I have never seen that term mentioned before. All google turned up was some parabolic sar stuff. Anyway, I typically use divergence as confirmation I am going in the right direction. That chart is also part of my mop up strategy, which is indi based but is combined with price zones. I prefer to use candle sticks and patterns such as double tops and bottoms.
Ignored
You dount know what is parabola? Basic geomtery..
When price progresses exponentially it runs out of liquidity (sooner or later) thats so called overboght/oversold condition, BUT you can't trade solely on these statistical deviations without PA levels.
I dropped all divergences and indicators long time ago.. Uselless sh*t for me. Same goes for MA's
I would not worry to much about it... People will learn in markets their is no such thing as perfect well defined patterns. The harder it is to find the better the trade will be. People will learn all it takes is time and enough money being lost and that loss will make them have a very agonizing reappraisal of the chart and then the light will come on. Until that time the mind is closed.
When you see this kind of parabolic move and the order flow drops off this is excellent trade too! You can catch this kind of a exhaustion on multi hour charts it will make you a very happy person!!!!!!
{quote} You dount know what is parabola? Basic geomtery.. When price progresses exponentially it runs out of liquidity (sooner or later) thats so called overboght/oversold condition, BUT you can't trade solely on these statistical deviations without PA levels. I dropped all divergences and indicators long time ago.. Uselless sh*t for me. Same goes for MA's {image}