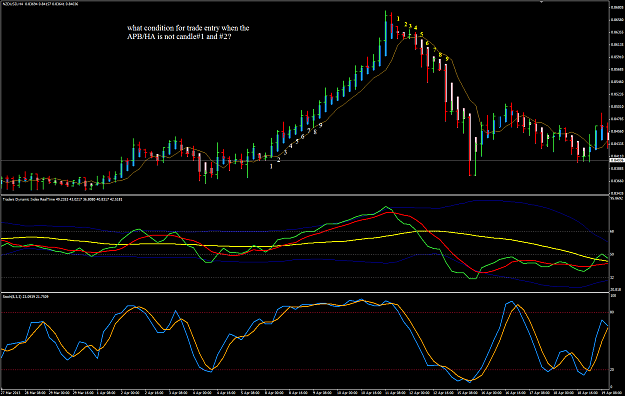
Heres that same GU chart on the H1.
I missed it because I wasn't near the PC at the time...and hindsight is always 20/20.
But look at the TDI cross in relation to the down trend line also previous areas off S&R around the RN of 1.53.
PA has now stalled on that lower level of support to the left.......
Now all I have to do is this consistently real time myself ..... LOL
If seniors here want to correct add to anything Ive said please do so....
W99
Attached Image (click to enlarge)