Thanks Pipsmurfer. and yes Greed is one of the hardest thing to overcome when playing stocks and forex anyway just wandering what should I do when something like this happen : Pic 1, H4 (the H4 and H1 cycle in my chart just started half hour ago) still pointing down {image} and Pic2, in H1 there's visible upward cross {image} should I long and get out within 1 hour or? Sorry in advance for the numerous questions.
Ignored
grand_dra9on,
I can see you are trying to compare two different timeframes for your entry confirmation and this may not work sometimes. On H4, you don't have any entry signal at all, however on H1, you do but I wouldn't be sure on TDI cross till I put the Stochastic on the H1 chart for confirmation. Please make sure your cross on both indicators are not close to oversold or overbought lines as your signal might be shortlived.
If you really want to get gain confidence with this system, please stick to only one timeframe. As most traders experienced, the signals on higher timeframes are more solid and you will need to have a good money management to avoid a big loss too.
{quote} Hello Phx 62, Was your trade entry based on the 15 min chart? I entered on the H1 chart. It was a red breaish red candle and I entered about 30 min after it formed. It turned into a pullback candle later on. But the 15 min tf would probably show a strong bearish candle. Should I stick to H1 and disregard the 15 min? or use it at reference? Thank you Also, what does MBL and TSL stand for? (market base line?)
Ignored
All my trades are taken and monitored on the H1 charts. On my trading screen I also have open a small M15 chart and a small H4 chart for reference but all my trades are entered and exited on the H1 chart. I sometimes look at the M15 chart to tell me of short term price changes that may be occuring and I use the H4 chart to see nearby S/R areas and price action on a larger time frame.....it just gives me an overall perspective of the market. In the case of the trade taken today, at LO, I saw on the M15 that the 1st candle went up and then pulled back, the next candle changed color and pulled back even more, so I entered on the H1. You are correct, price did pull back long an hour or so after entry but none of the H1 candles closed blue, so I stayed in the trade. If a candle had closed blue and price had gone against me by 15 or 20 pips, I would have exited the trade and looked for a better entry. Instead, price consolidated for a couple of hours and then moved down to hit my TP.
The lines on the TDI on my chart are as follows: the green is the RSI Price Line, the red is the Trading Signal Line and the yellow is the Market Base Line. Each of those lines gives me different clues about price.
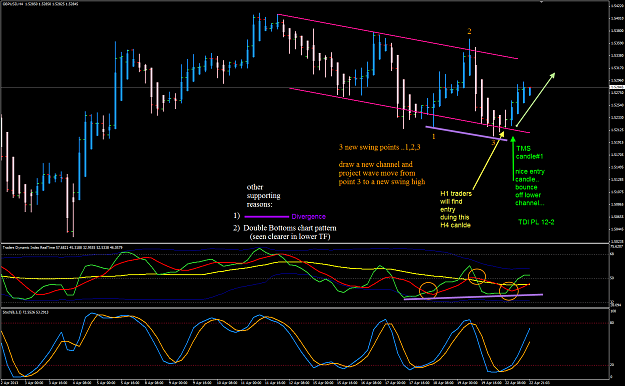
GBPUSD channel example week 17: Here is the latest channel drawn for GBPUSD. The current PA show price near the lower channel drawn. We must observe the PA to see if there will be a bounce UP or possible PA of breakout below the current channel. There are also 3 new turning points with TDI cross confirmation. See if you can identify that and draw a new channel and use that to track the PA and price move projection. {image}
See how it developed since my last post.
There are more reasosn for that trade - H4 PA/TDI Divergence, Double Bottem chart pattern.
Now you need to draw the new H4 channel using the most recent 3 swing points high and low. Use that to project the current wave move up and maximise profit using the PA of APB/HA.
Trade Well folks... practice, practice, practice.
It's wierd hours for me ... along the west coast time zone...
Attached Image (click to enlarge)
Honesty is a very expensive gift. You wont find it in cheap people.WBuffett
Along with GBP strength, you could have traded EG sell yesterday and this wold have help you make a easy decision to buy GU.
Look at more pairs - EURxxx and GBPxxx pairs on H4. These will give you average 20 good quality trades a month...if you play the R and R=Multiple game well, 10% return is a breeze in 20 trading days.
Honesty is a very expensive gift. You wont find it in cheap people.WBuffett
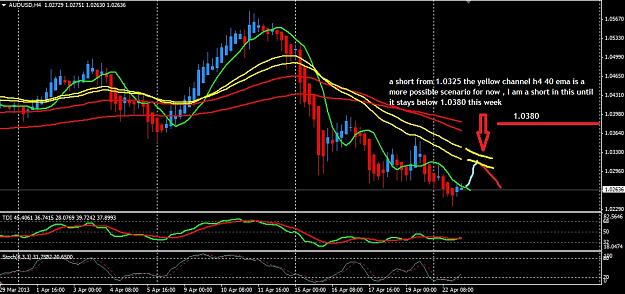
Now H4 PA shows it is sitting on 1.0250 and naoorwing range as TDI VB shows.
I want to trade the next big move....
how to trade big move?
what to look for?
when will it happen?
Honesty is a very expensive gift. You wont find it in cheap people.WBuffett
{quote} All my trades are taken and monitored on the H1 charts. On my trading screen I also have open a small M15 chart and a small H4 chart for reference but all my trades are entered and exited on the H1 chart. I sometimes look at the M15 chart to tell me of short term price changes that may be occuring and I use the H4 chart to see nearby S/R areas and price action on a larger time frame.....it just gives me an overall perspective of the market. In the case of the trade taken today, at LO, I saw on the M15 that the 1st candle went up and then...
Ignored
Thank you very much. Even though I took a similar trade as yours, I failed to look at the other trade criteria.
Here is how I see it.Since it is bearish under my emas I would look for shorts when it comes near to 1.032x.Your next big move could be up from there or down from there . But overall I would wait over 1.0350-80 to long it.
Regards,
AU week 17 22 Apr: Now H4 PA shows it is sitting on 1.0250 and naoorwing range as TDI VB shows. I want to trade the next big move.... how to trade big move? what to look for? when will it happen?
{quote} Jackub, Hey, why lose sleep over this 5 reasons. Make it simple - think of the TMS entry rules... TDI cross, bounce 12-2 , 4-6 APB candle #1 and #2 PA Supp/Res Stoch confirm or higher Tf confirm the Primary Trend you want to trade.
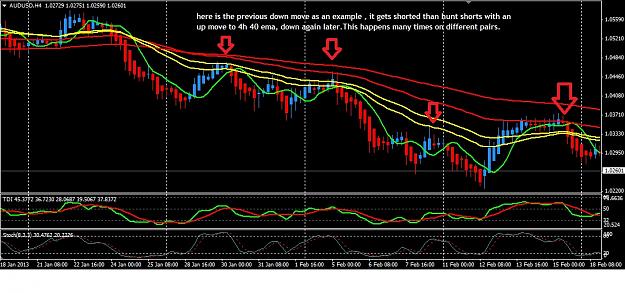
Hi emmanuel, Here is how I see it.Since it is bearish under my emas I would look for shorts when it comes near to 1.032x.Your next big move could be up from there or down from there . But overall I would wait over 1.0350-80 to long it. Regards, Okan {quote} {image} {image}
Ignored
Hi Okan,
Thanks. Now I see what you mean.
That is a simple way to see the flow. Good.
Regards,
Honesty is a very expensive gift. You wont find it in cheap people.WBuffett
{quote} You are correct, price did pull back long an hour or so after entry but none of the H1 candles closed blue, so I stayed in the trade. If a candle had closed blue and price had gone against me by 15 or 20 pips, I would have exited the trade and looked for a better entry. Instead, price consolidated for a couple of hours and then moved down to hit my TP..
Ignored
It's nice seeing everyone here got profits yesterday. Except me with a small loss dues to that reason haha.
Aggressive long entry when price pulled back, then formed triple tops on H1 so I quitted with 10pips loss before the price falls.
EJ Trade from yesterday, now what to do to best manage this out come ??
Cant say Ive been in this position very often. Trying to slow down and look at bigger picture stuff......
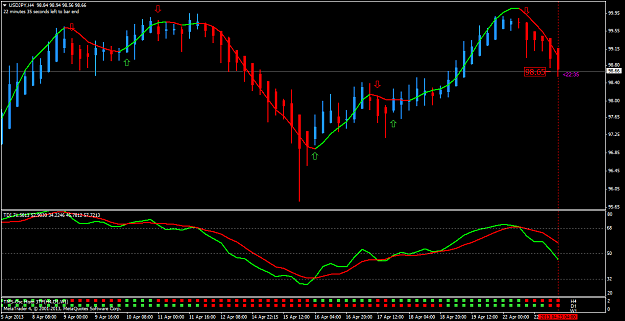
{image} What do you guys think about shorting USD/JPY ?
Ignored
You have the signal to short the pair except for two reasons not to take it. First, you are entering the trade on 6th candle and the second is sitting on a support line which use to be resistance. (look on your left side and you will see two double top and then had a break out). So it is best to wait for london openning and see if we get a retracement or not.
After that, you might find a right signal to enter the short. I shorted this pair during Asian session on candle no 3 and struggled to go down but finally managed to take 35 pips and i think its better to wait to get a better picture after london opening.